UO Solar Radiation Monitoring Laboratory

Home page button

Sponsors button

Site map button

Search button

Contact us button

Software Tools button

Sun path chart program button

About sun path charts

Sun path chart basics
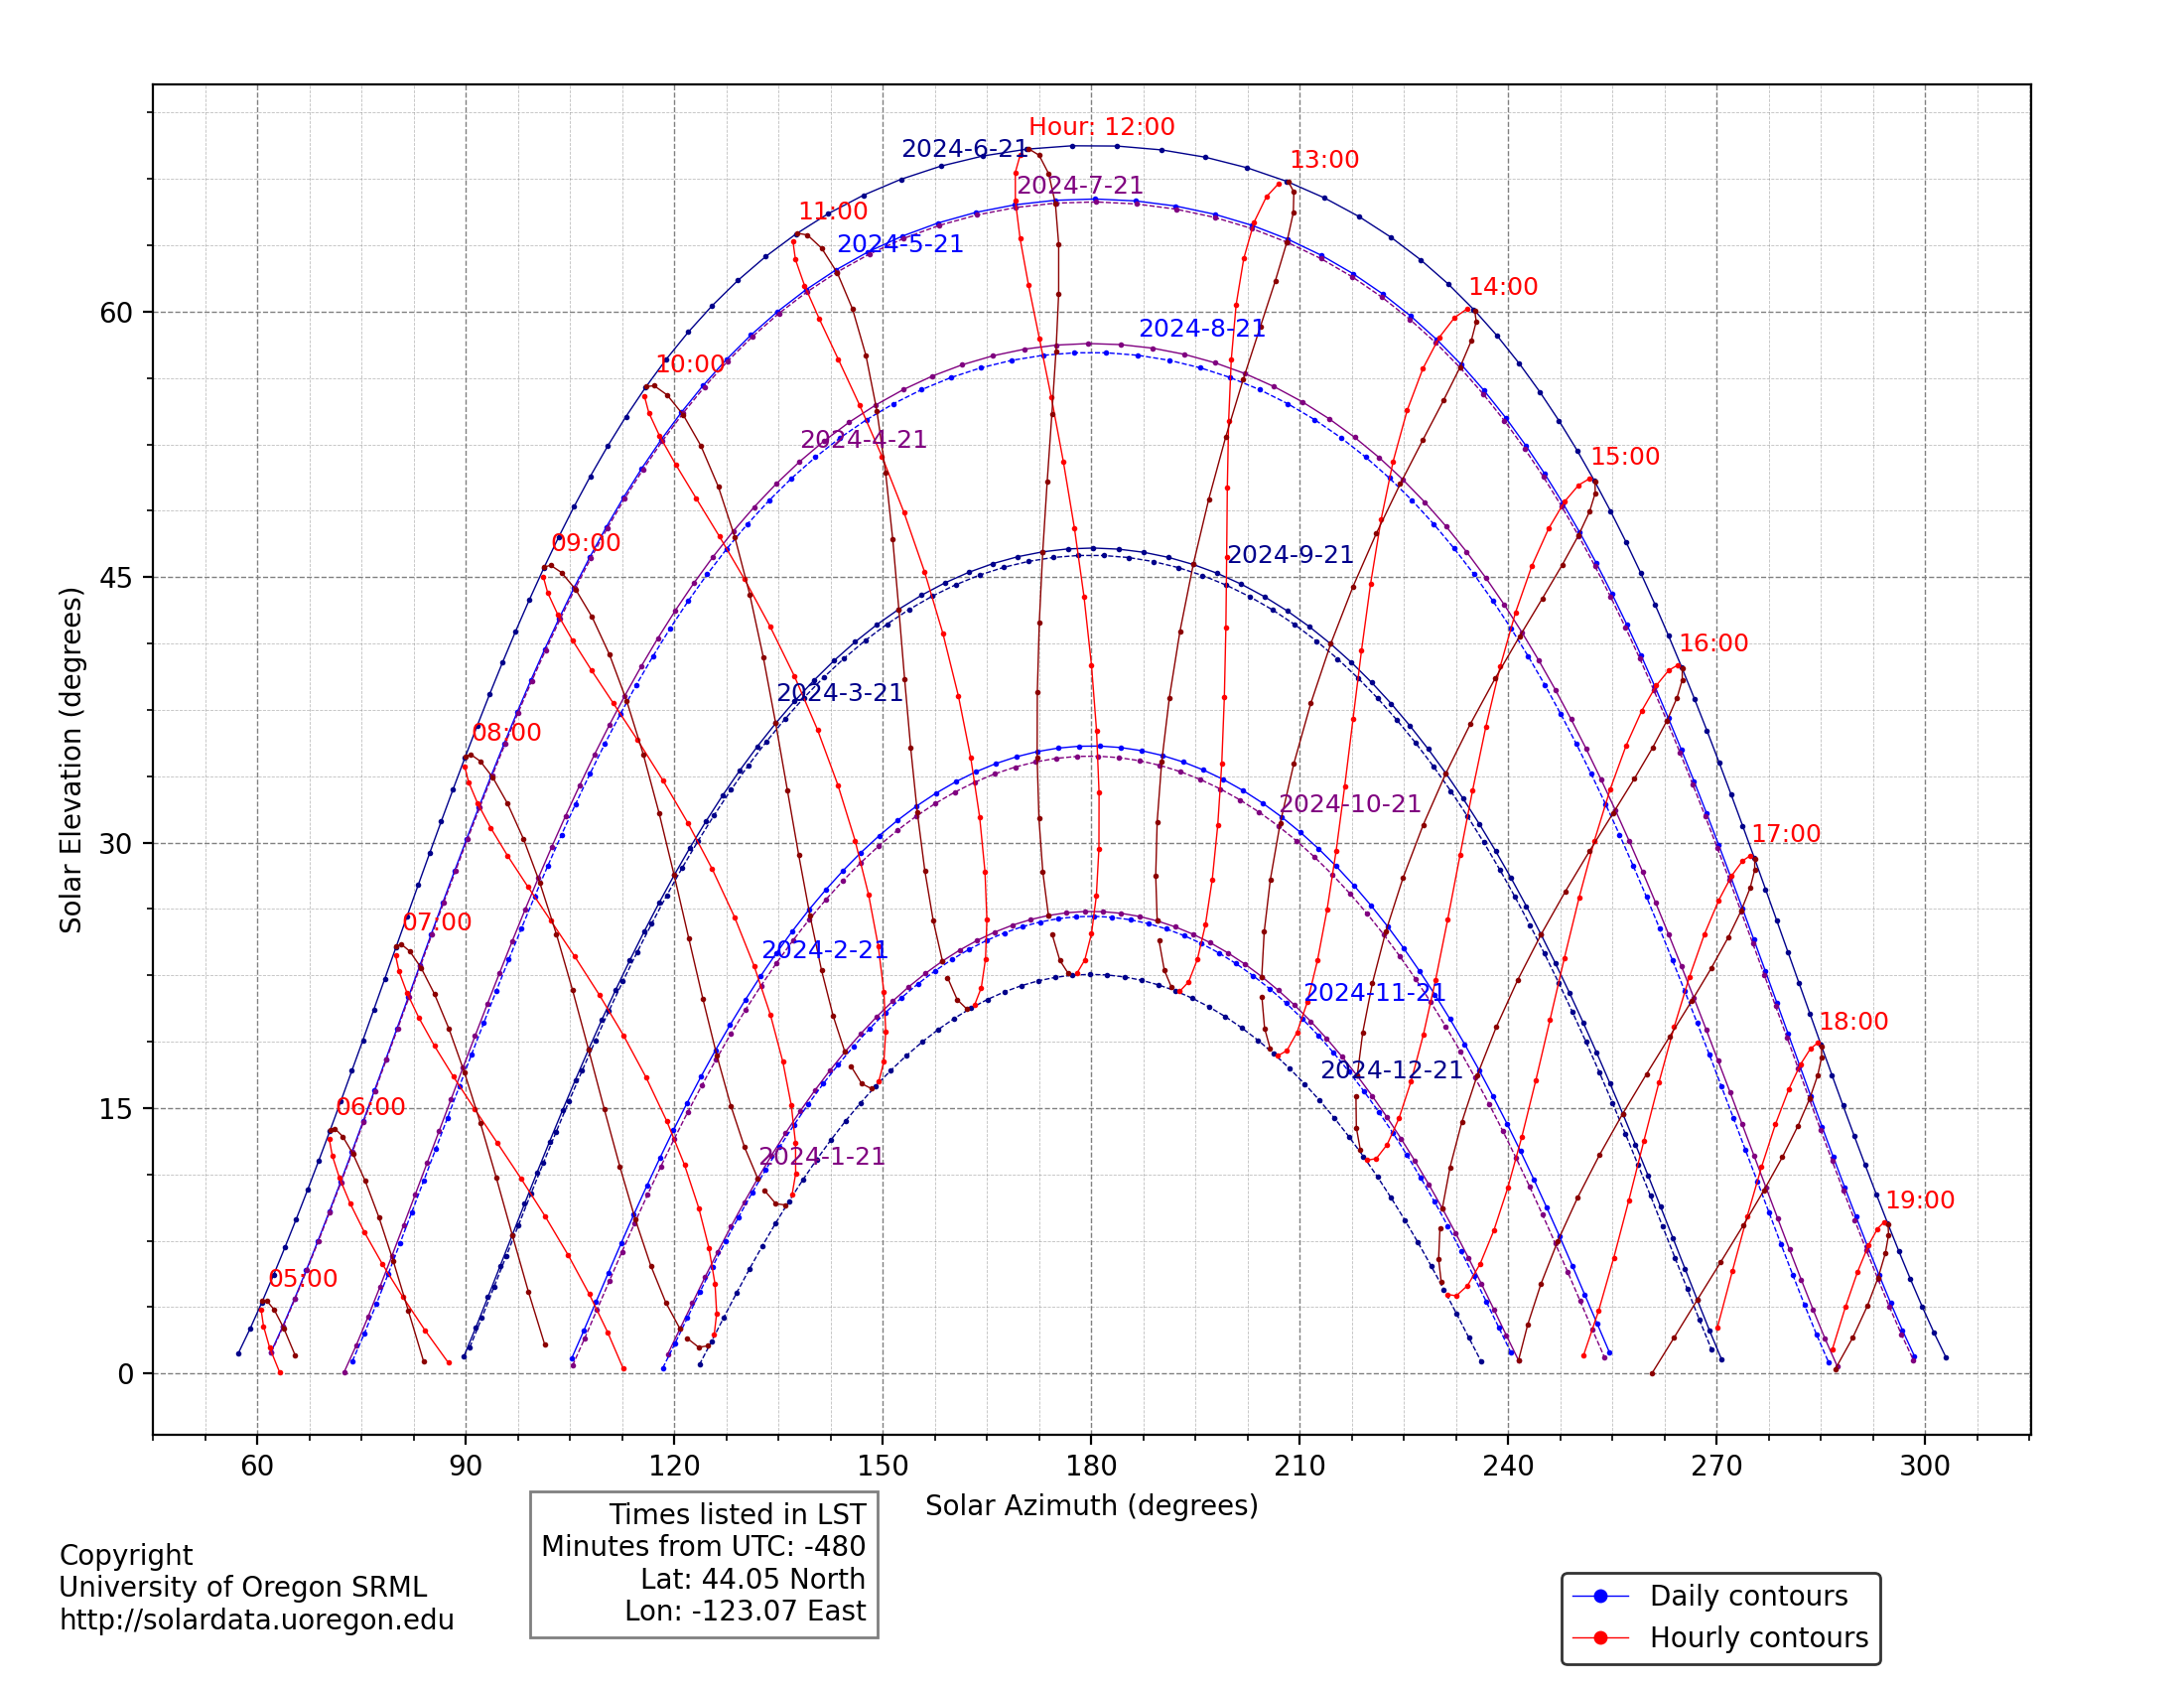
Sun path charts plot the sun's elevation angle and azimuth angle over a day, as seen from a given location. The elevation angle measures the height of the sun in the sky from the horizon; it's the complement of (90 degrees minus) the zenith angle of the sun. The azimuth angle indicates the direction of the sun in the horizontal plain from a given location. North is defined to have an azimuth of 0° and south has an azimuth of 180°.
In addition to depicting the path of the sun in terms of its elevation and azimuth angles, sun path charts indicate particular times of the day. We plot the time, on the hour, for all hours during which the sun is visible for a given location. You may choose either local standard time or local solar time. Local solar time is based on the sun's position, and is independent of longitude. Noon in solar time occurs when the sun is at its highest point in the sky for the day, and it is either due south or due north of the observer depending on the latitude and time of year (in the tropics).
An explanation of using a sun path chart to orient a greenhouse to receive the most sun can be found by clicking here. This site also has information on how to use tools such as a compass with the the sun path chart.

Cartesian and polar coordinate sun path charts

Sun path charts can be plotted either in Cartesian (rectanglar) or polar coordinates. We are most familar with Cartesian coordinates where the solar elevation is plotted on one axis and the azimth is ploted on the other axis at right angles to the first axis. Polar coordinates are based on a circle where the solar elevation is represented by smaller and smaller circles as the elevation increases and the azimth is the angle going around the circle from 0° to 360° degrees.

Using sun path charts for site analysis

Sun path charts are used to identify when objects will block a collector from direct sunlight. To use the chart for site analysis you need a compass and a clinometer—a device used to determine the angular height of an object. With the compass, the azimuth angle can be determined; the clinometer will provide the elevation angles of the surrounding horizon and obstructions. The horizon diagram on the sun path chart can be used to find a location with a minimum of shading.
The Energy Trust of Oregon contracted with us to produce shade analysis forms for Oregon locations using the TMY2 database to estimate the percentage of the total annual output of electricity produced by a photovoltaic system when the sun is in various sectors of the sky. Instructions on using the shade analysis forms can be found in Evaluating a Site's Solar Potential. (View sample form in Cartesian coordinates. View sample form in polar corrdinates.)
Note that a compass reads magnetic north, so a correction must be made to find true north for the sun path chart diagrams. This correction factor can usually be found on good maps or at the National Geophysical Data Center Website. On a sunny day, the local standard time hour marks on the sun path charts can be used to determine the approximate azimuth. Use a watch to determine the time of day (be sure to subtract an hour to caluclate local standard time from daylight savings time) and orient the chart so that a shadow from a pencil placed at the time of day and year crosses the middle of the azimuthal axis - either the 180° or 0° azimuth. This method is also useful for verifying the compass readings to with approximately five degrees.

More about our sun path charts

On our sun path charts plotted in Cartesian coordinates, the azimuth angle is plotted either east to west or west to east depending if one is in the northern hemisphere facing south or the southern hemisphere facing north. For northern latitudes, the azimuth angle varies from 0° (north) to 90° (east) to 180° (south) and back to 360° (north). In plotting sun paths for southern latitudes, we assume you will be facing north and have the azimuth going from west to east. The azimuth angle ranges from -180° (south) to -90° (west) to 0° (north) to 90° (east) and back to 180° (south). These two conventions ensures that charts for northern and southern latitudes are similar. Note that the azimth angle of -90° (west) is the same as the azimuth angle 270° (west).
Whether the chart is for a northern or southern latitude, the plotted Cartesian corrdinate sun paths represent positions of the sun with respect to an observer facing the equator. Consequently, these charts take on an unusual appearance for latitudes within the tropics. Outside of the tropics, the sun at solar noon is always toward the equator with respect to the observer. Within the tropics, there are days when the sun will be somewhat "behind" the equator-facing observer at solar noon. In such cases, sun paths are plotted discontinuously on the chart. Please keep in mind that there is not really a discontinuity in the sun's path, and if you were to fold the chart to make a cylinder, joining it at azimuth points 0° and 360° (for northern latitudes), or -180° and 180° (for southern latitudes), you would see that all plotted sun paths are continuous. Both the apparent discontinuity in certain sun paths and other effects result from an attempt to represent spherical geometry by projecting it on a plane. You might find it helpful to plot the sun paths on a polar projection if they don't seem intuitive.

Image map links to top of page and home page
Link to top of page Link to home page
© 2022, UO Solar Radiation Monitoring Laboratory.
Last revised: March 4, 2022.


Top of page
Site map
Software tools
Home page
Search
Sun chart program
Sponsors
Contact us

Home page URL: solardata.uoregon.edu