|
|
|
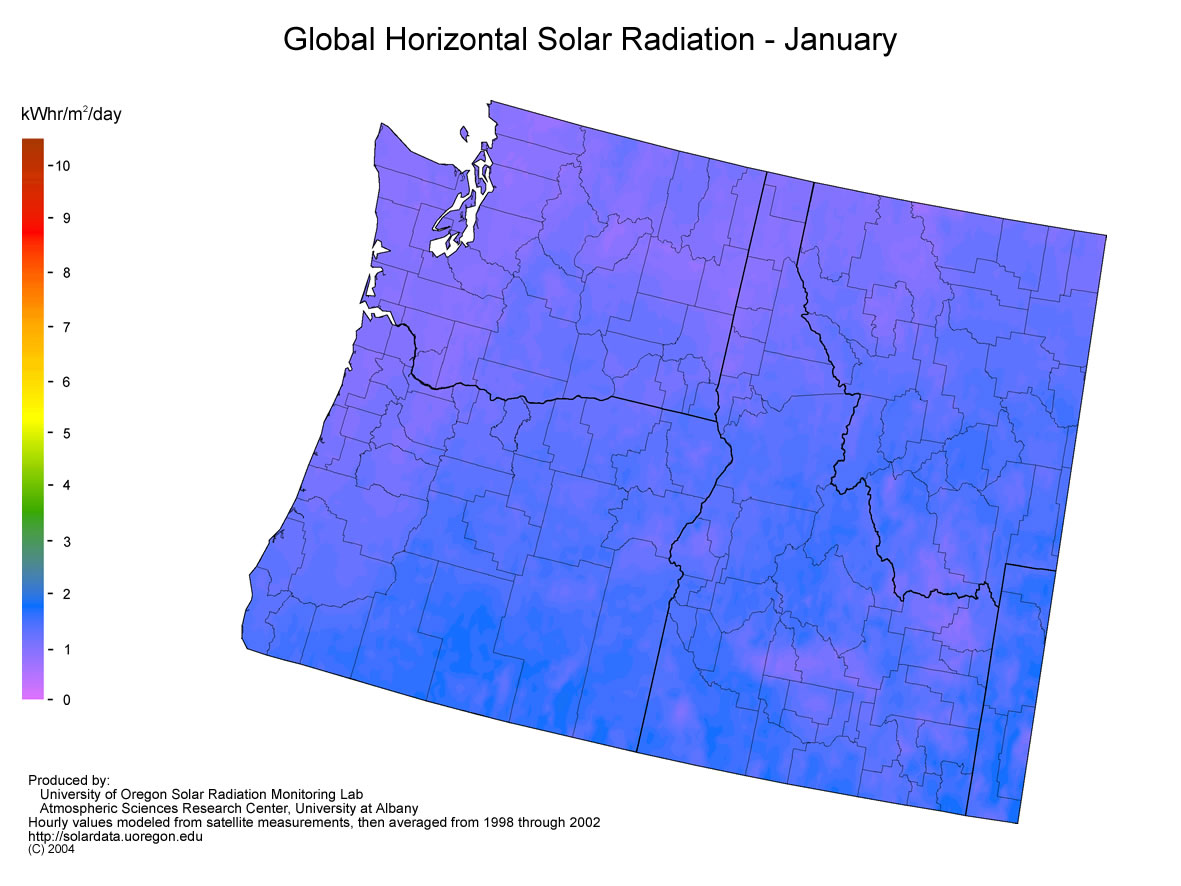
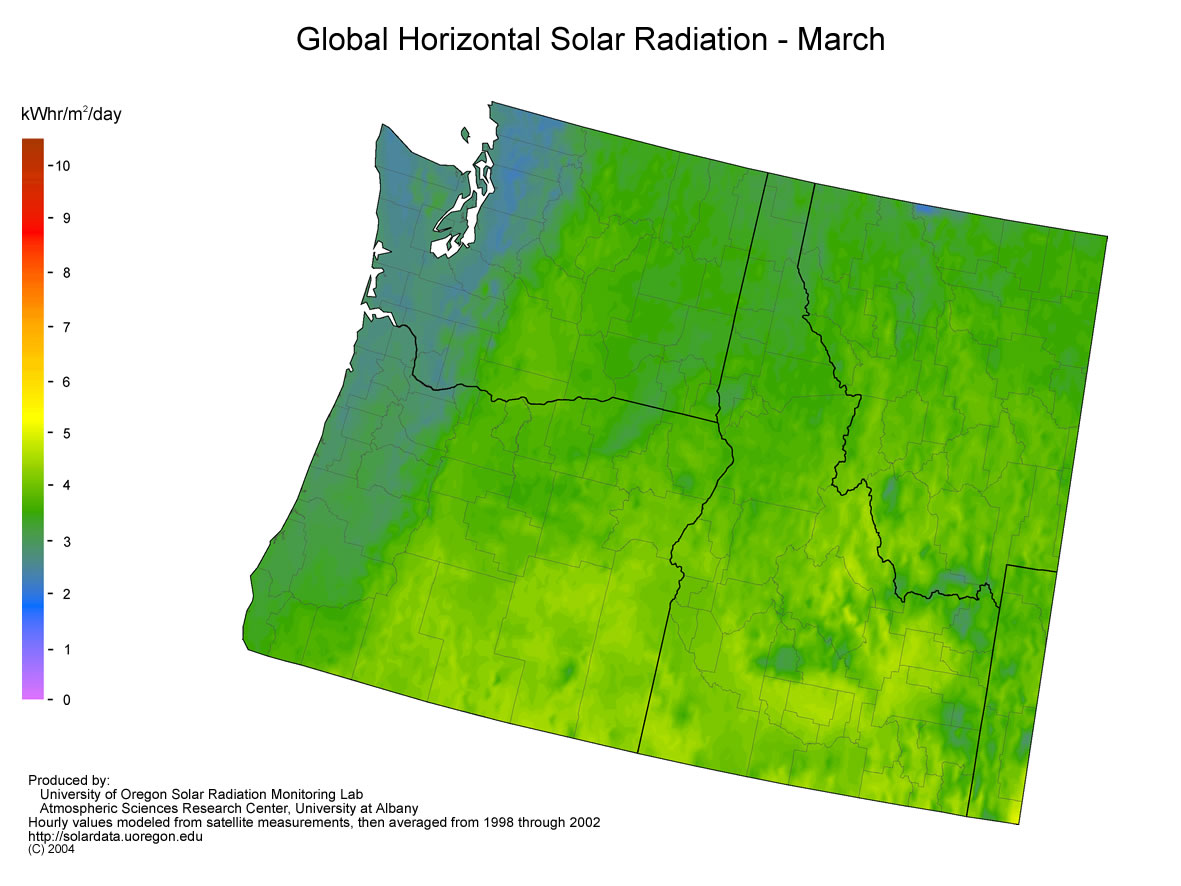
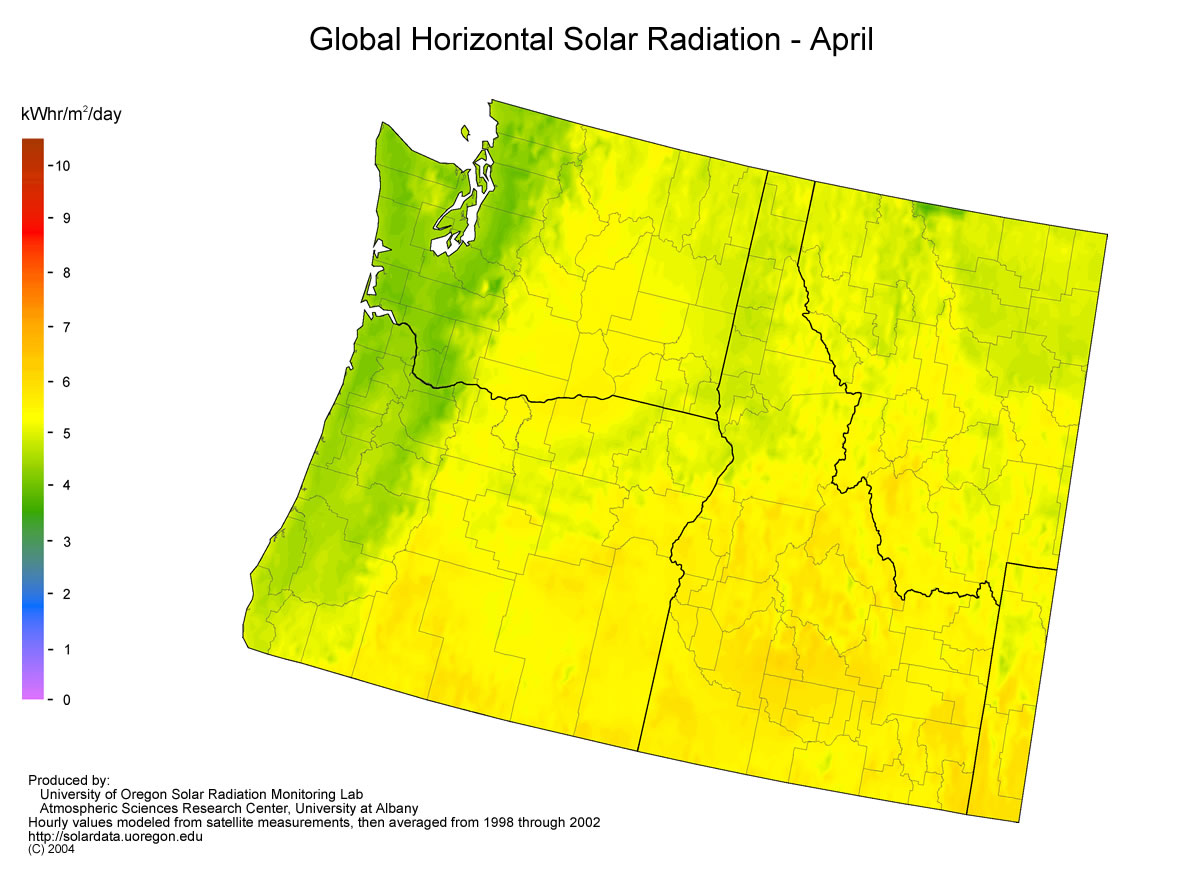
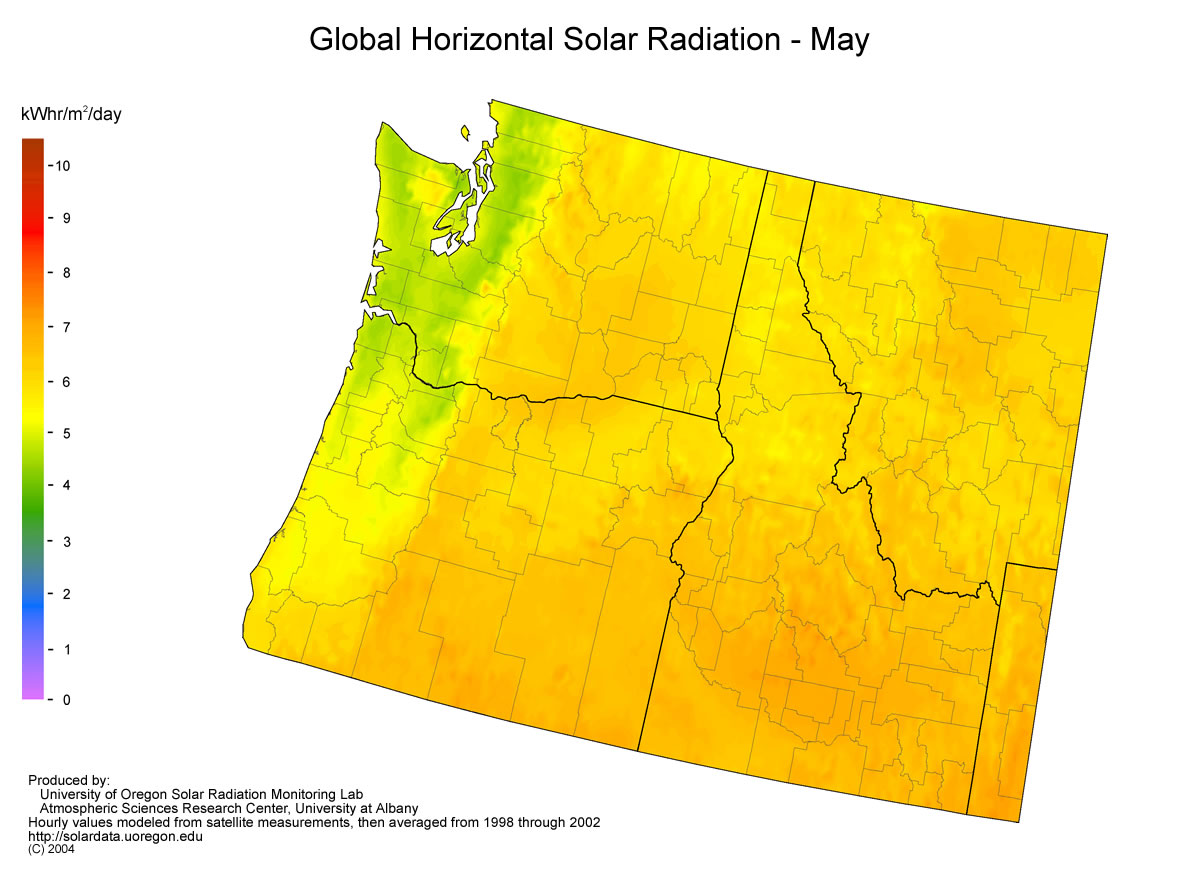
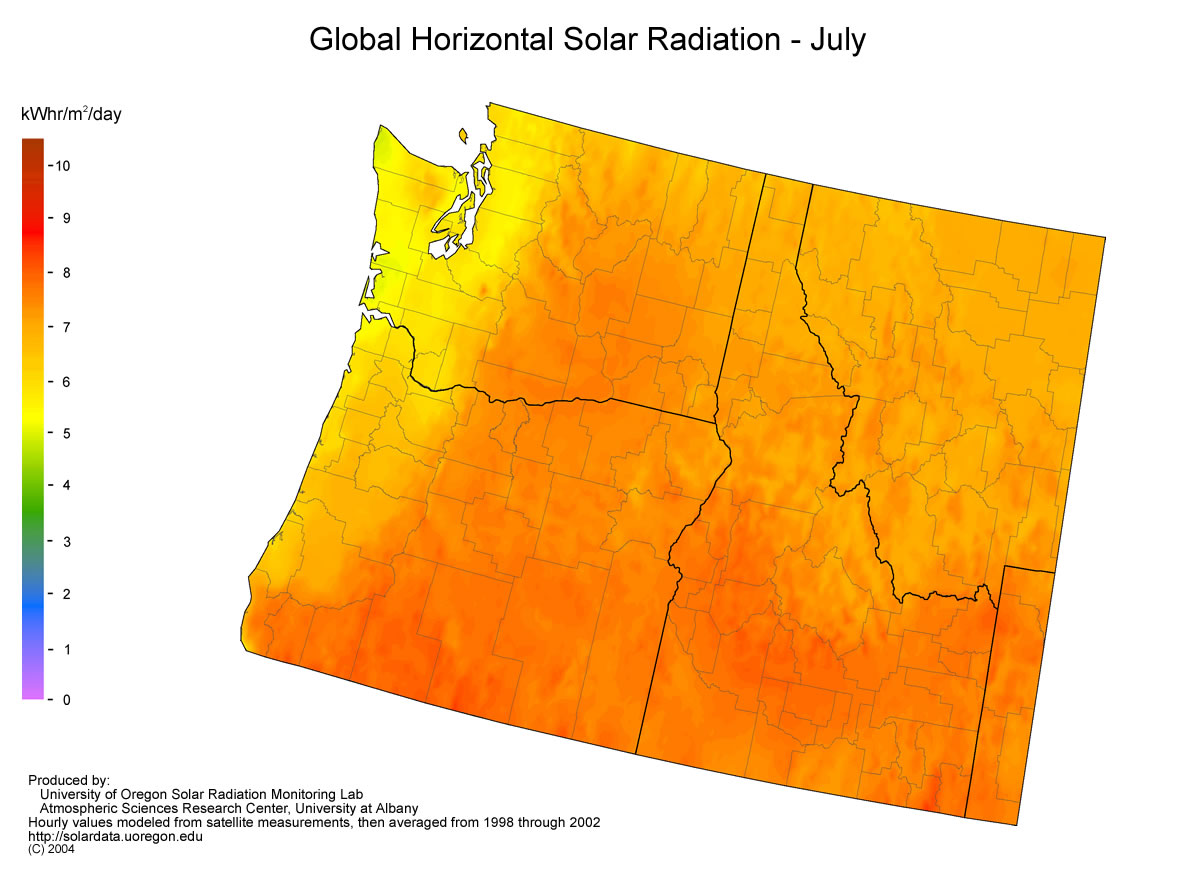
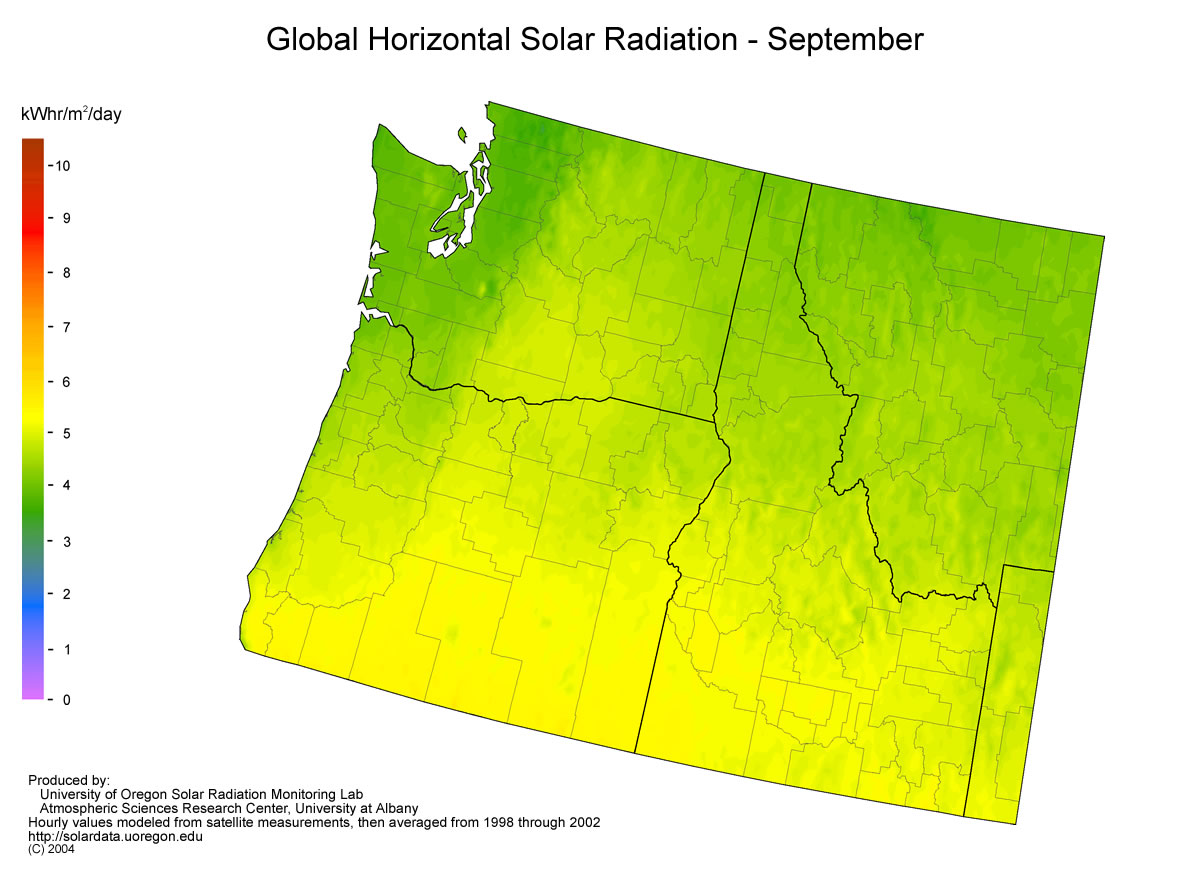
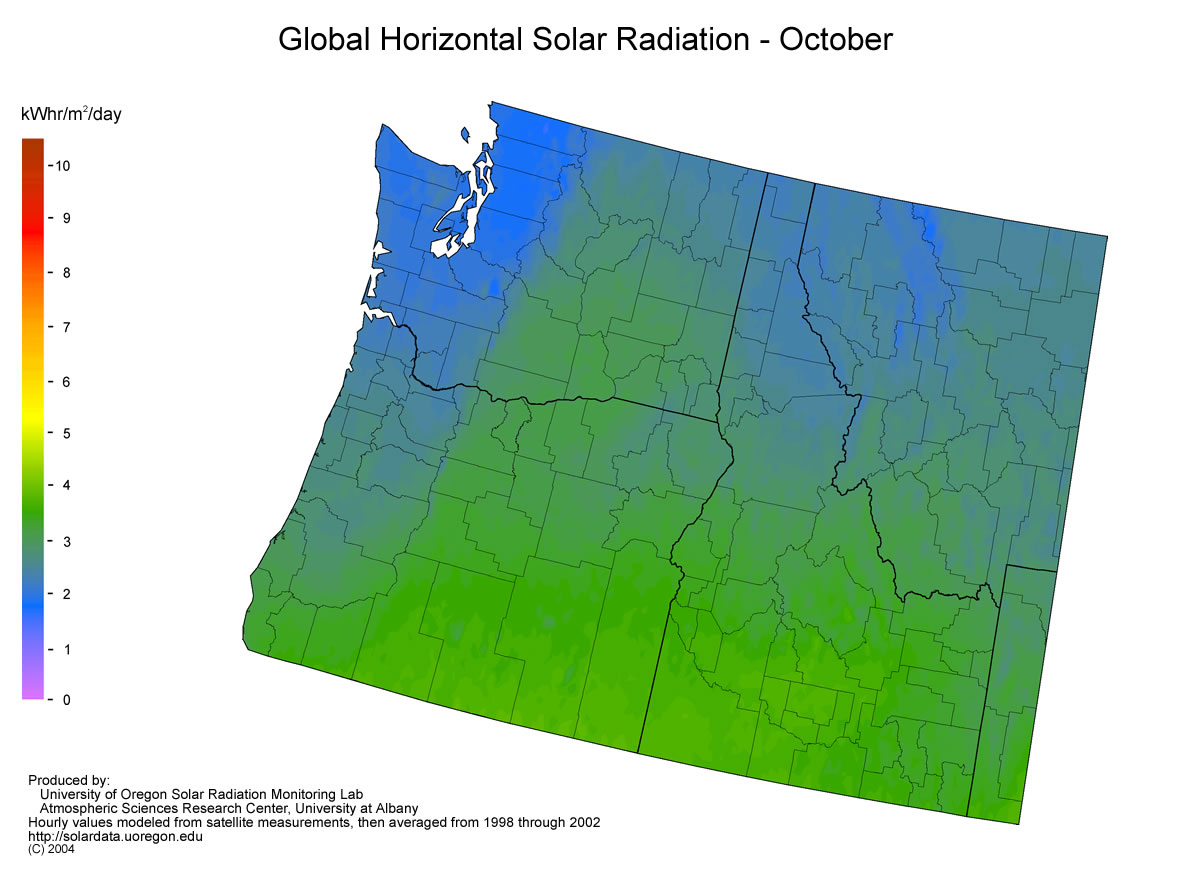
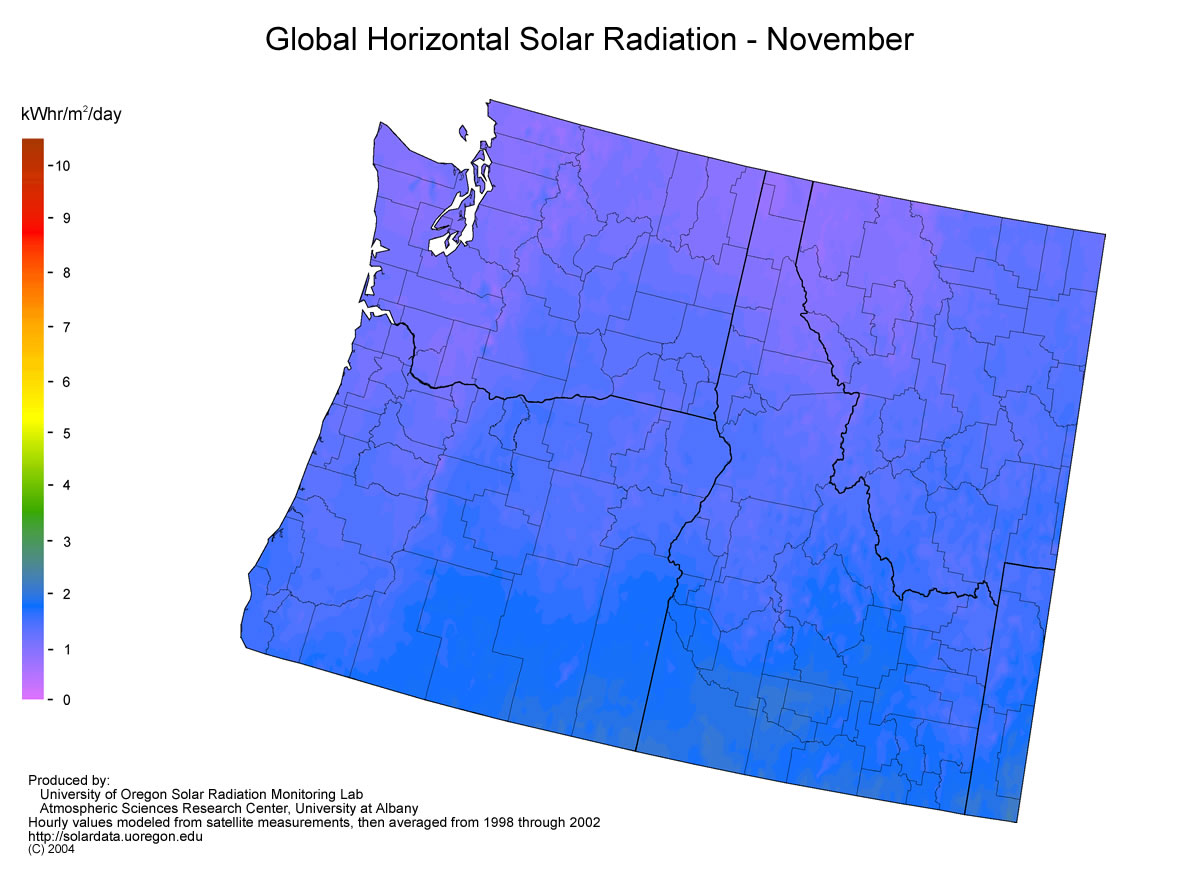
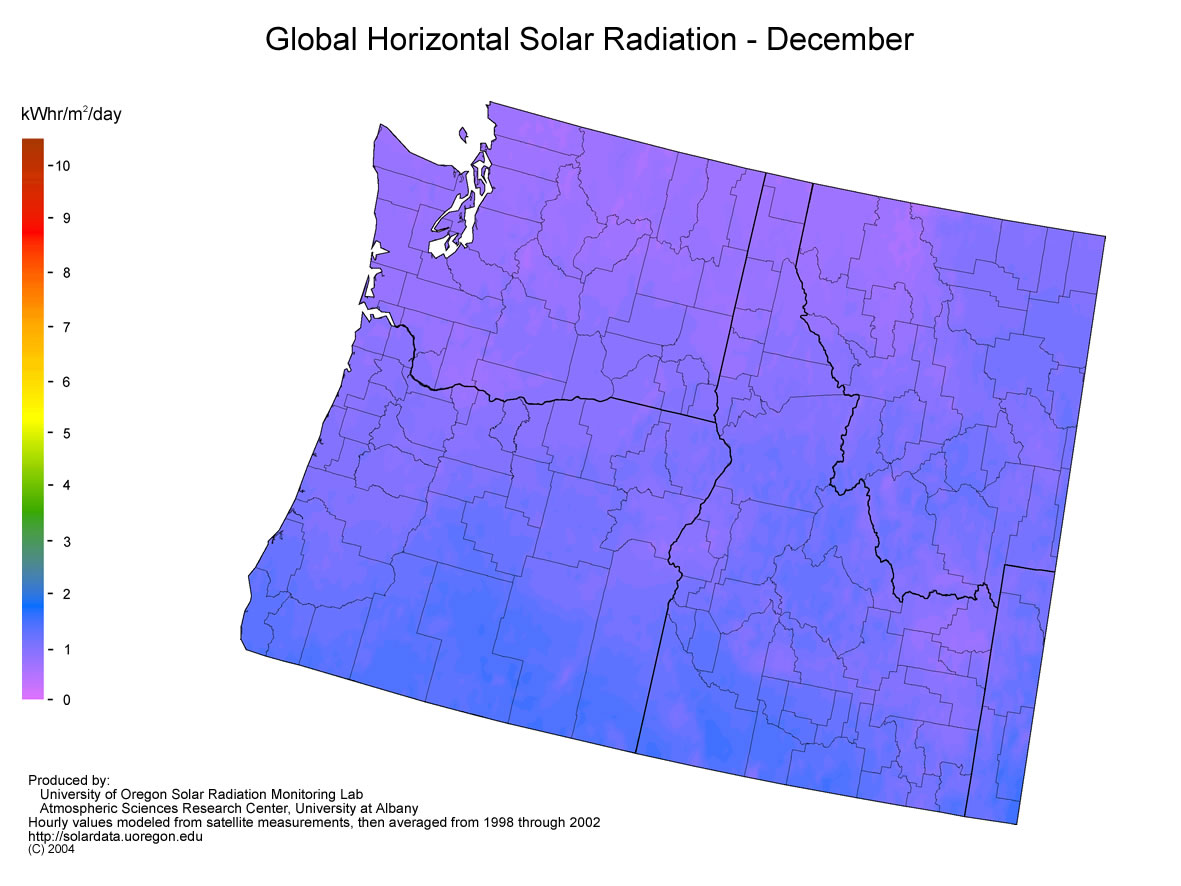
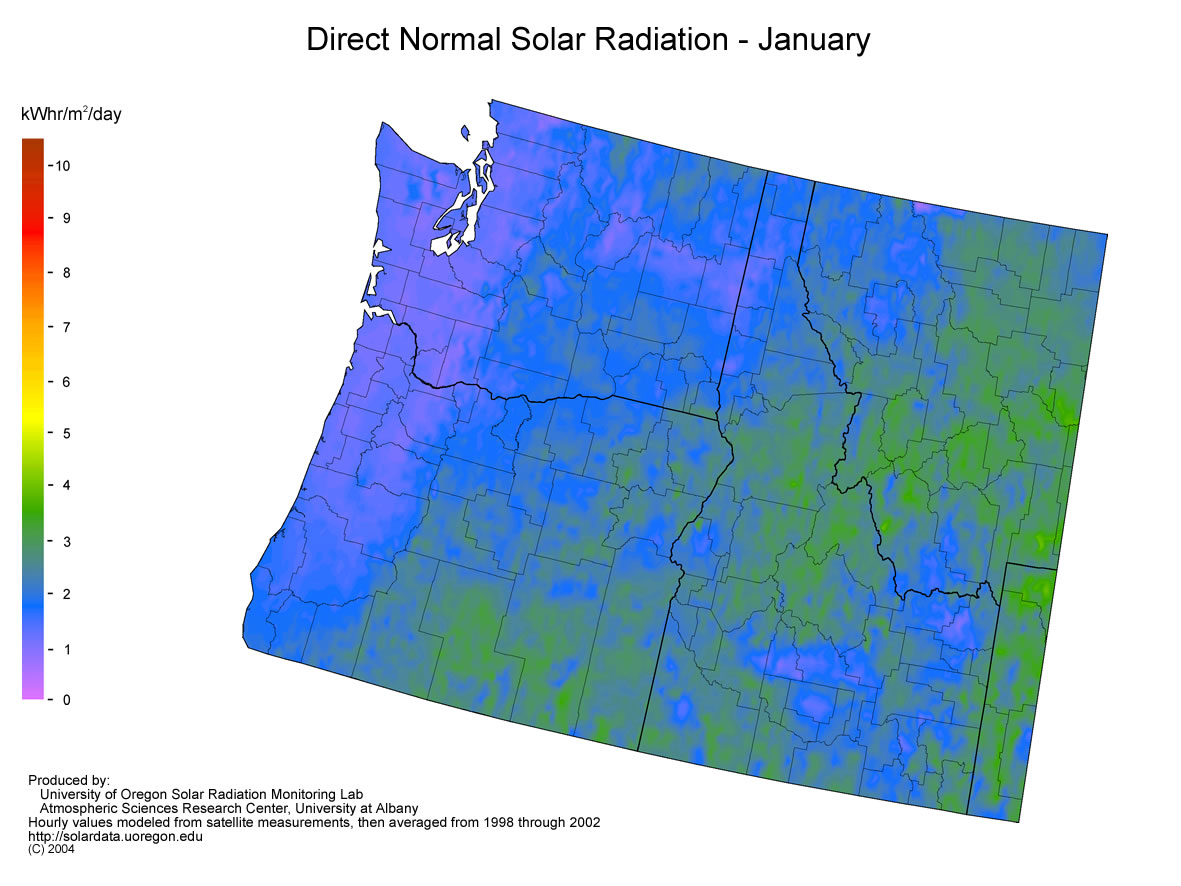
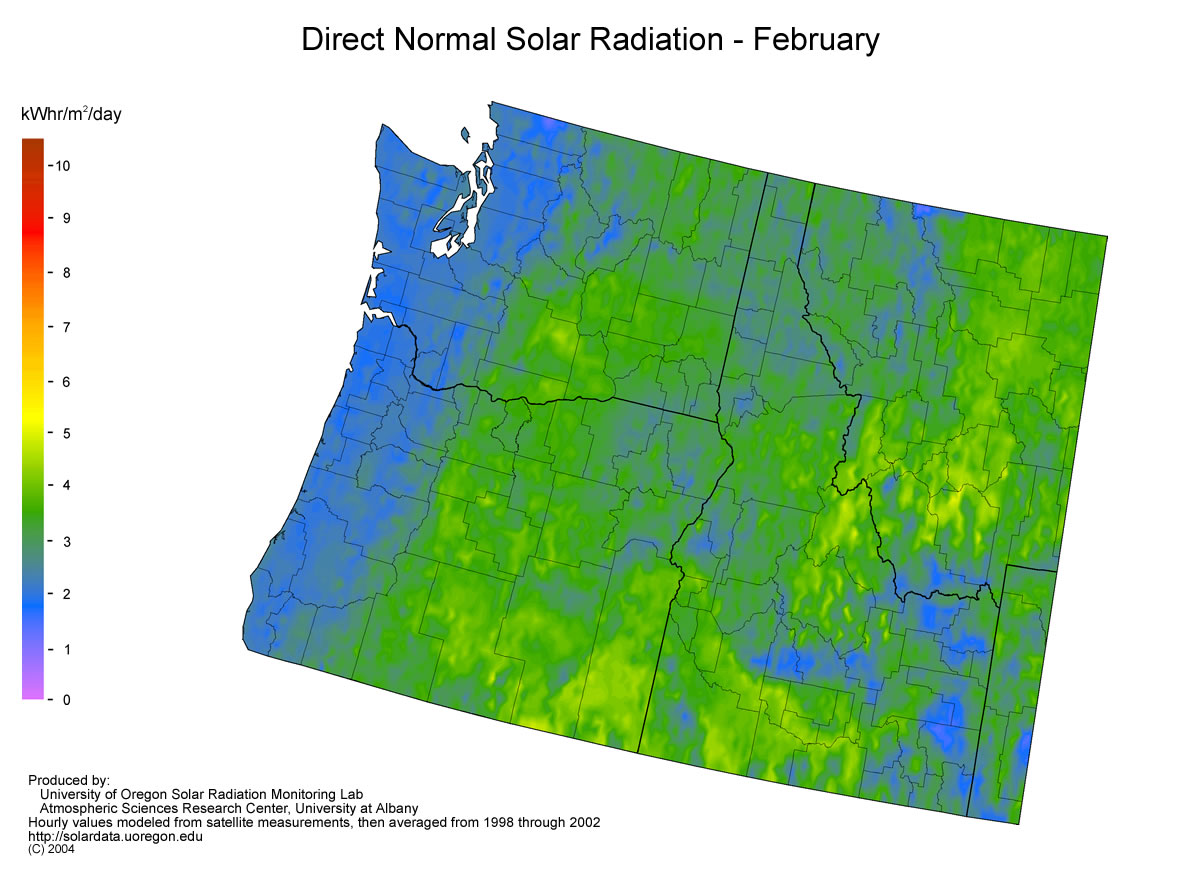
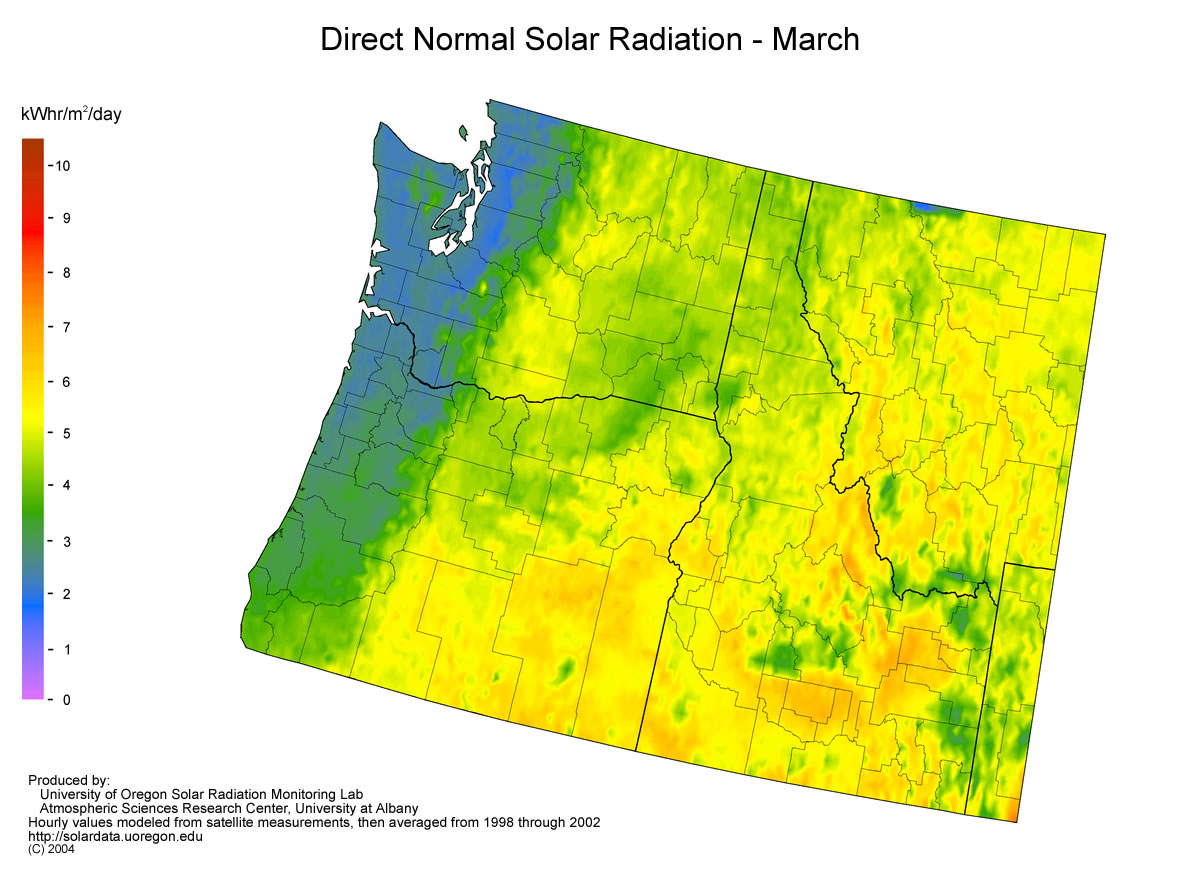
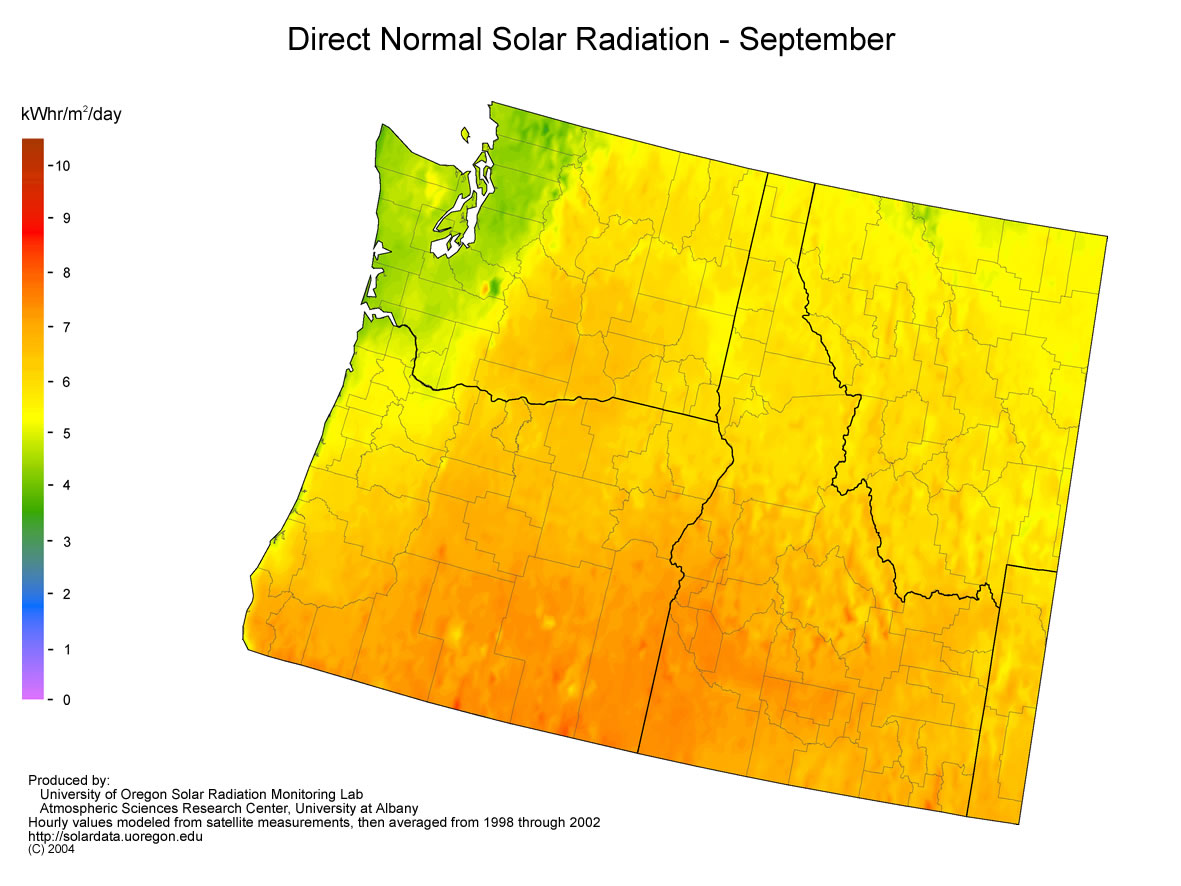
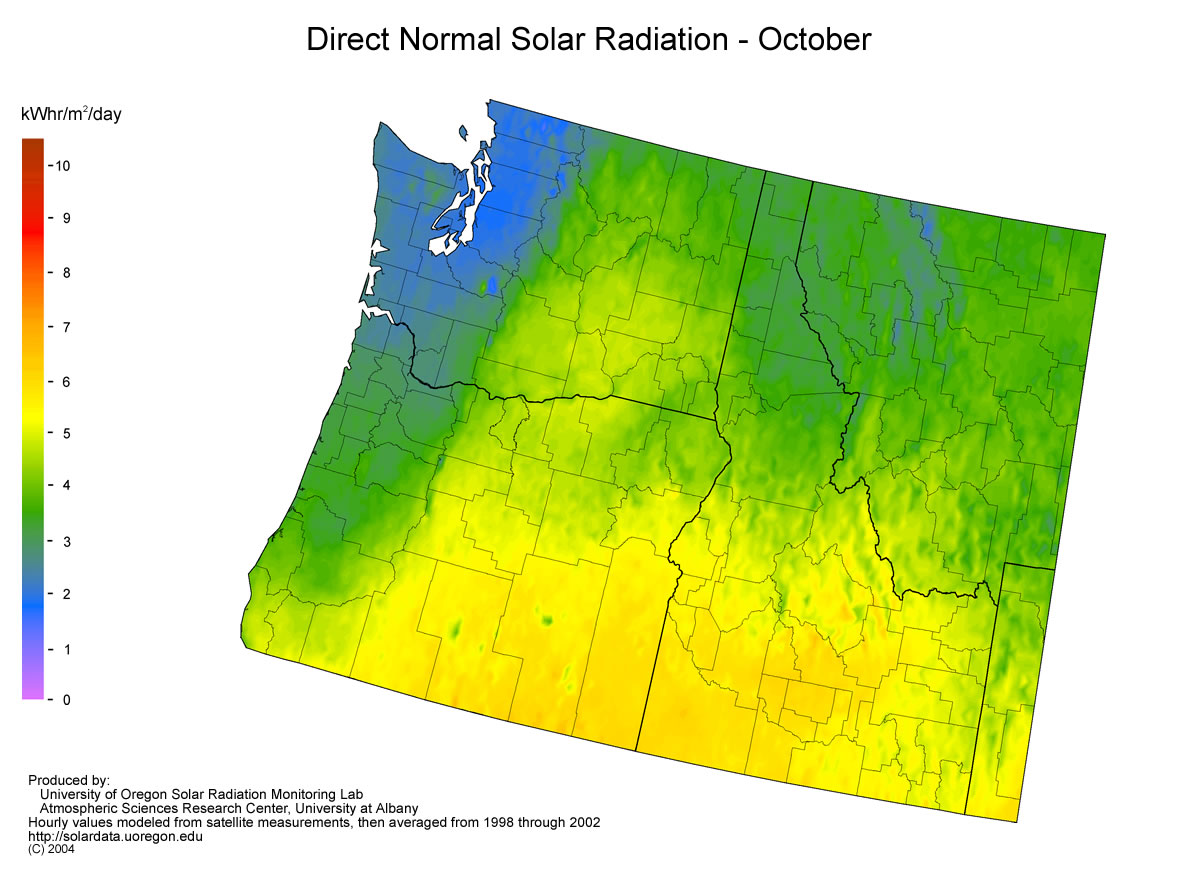
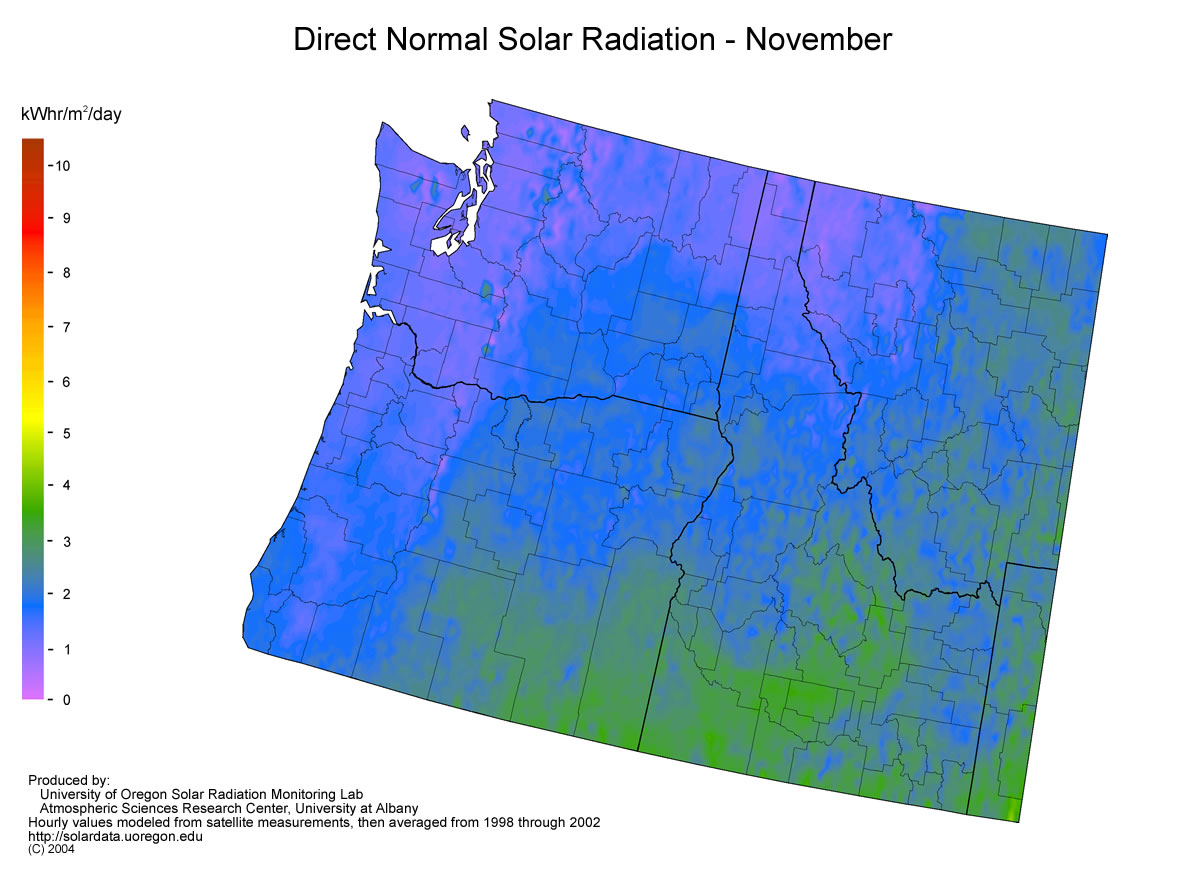
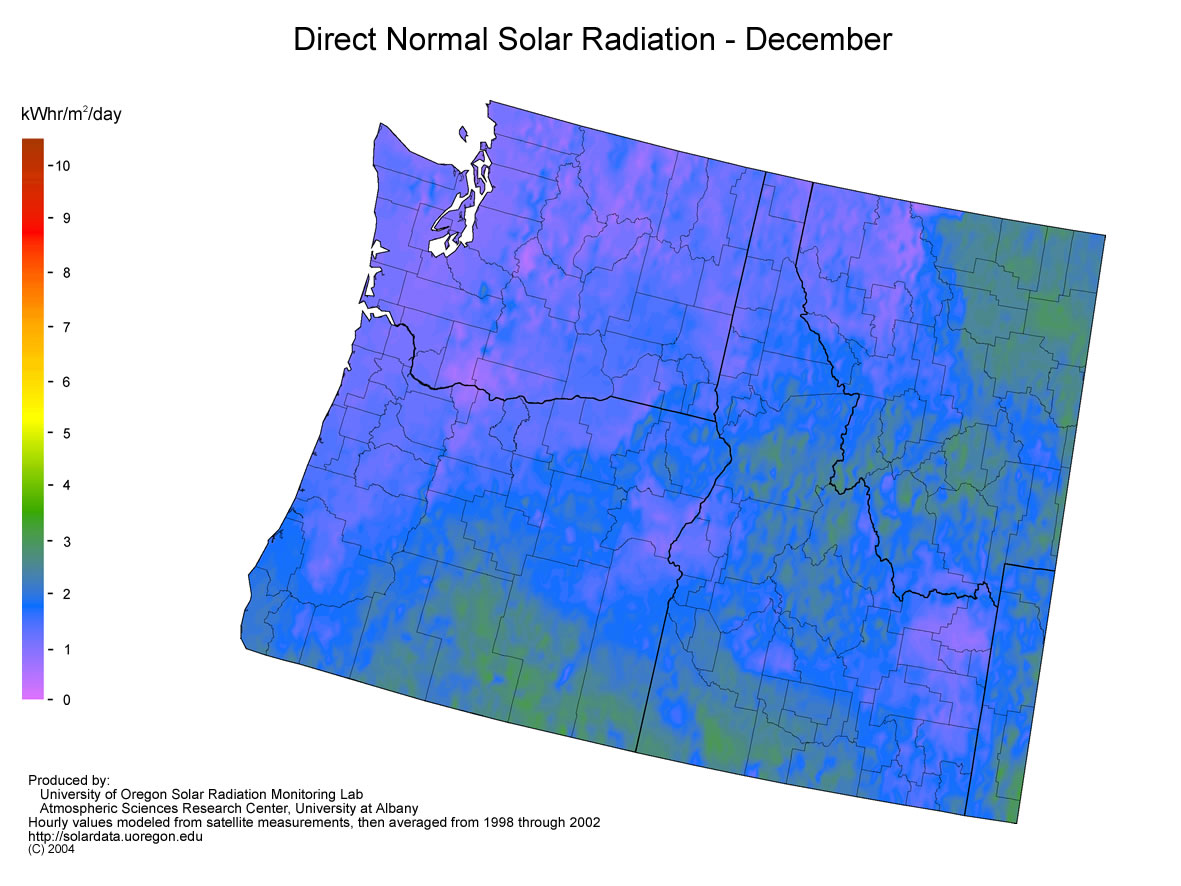
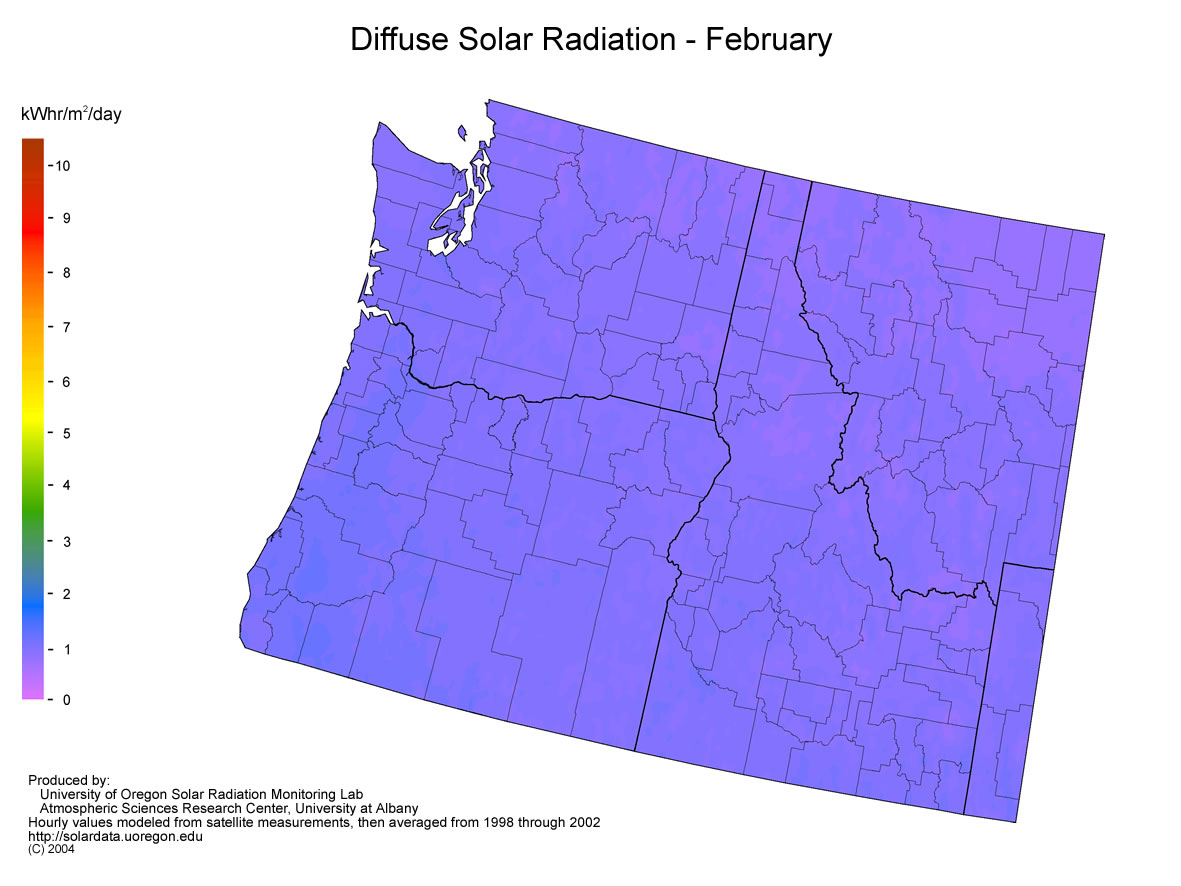
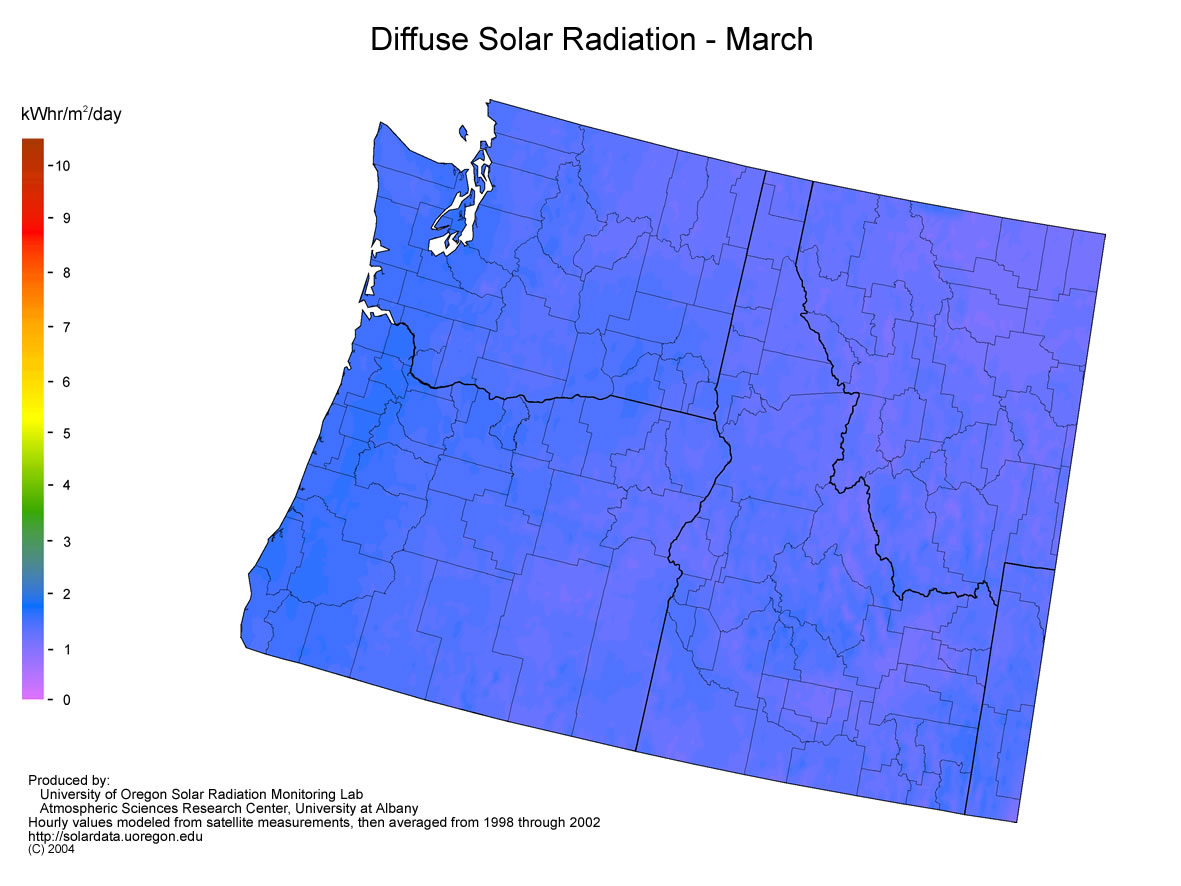
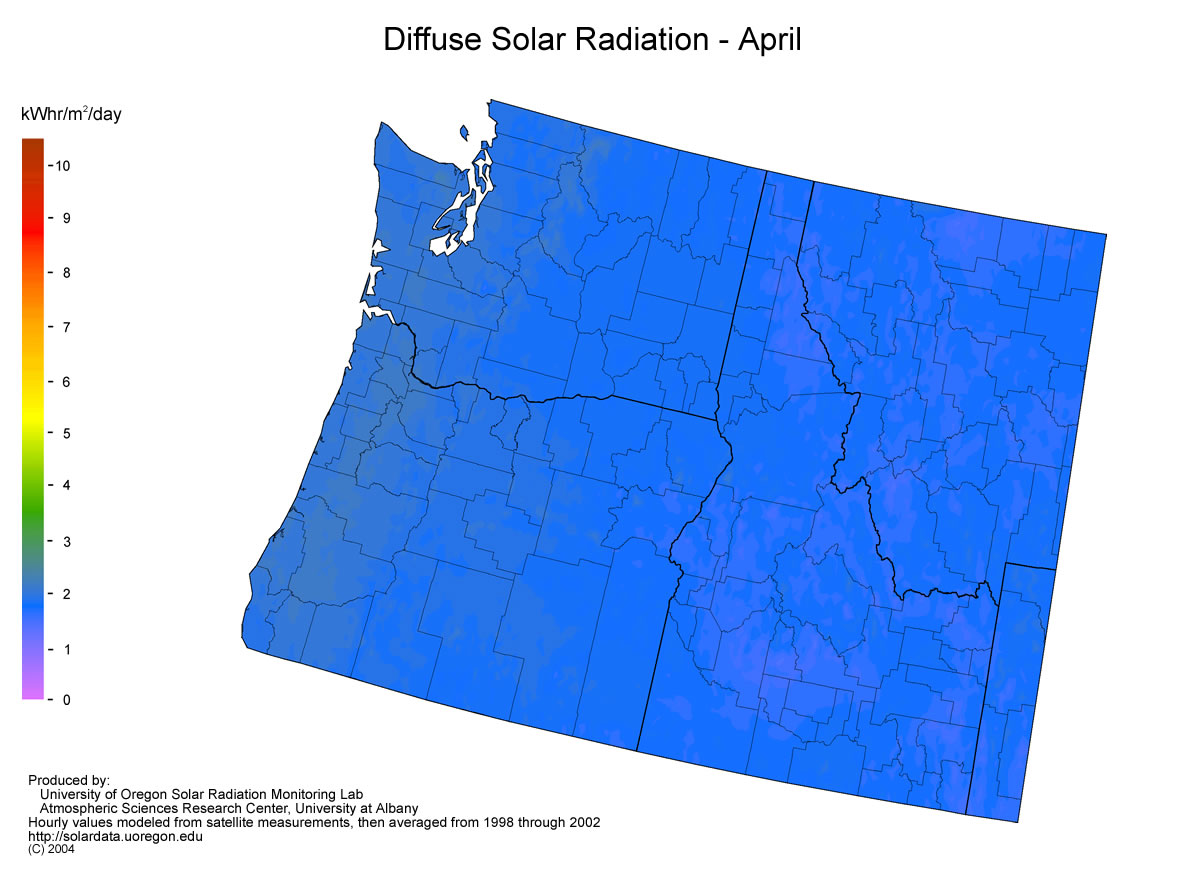
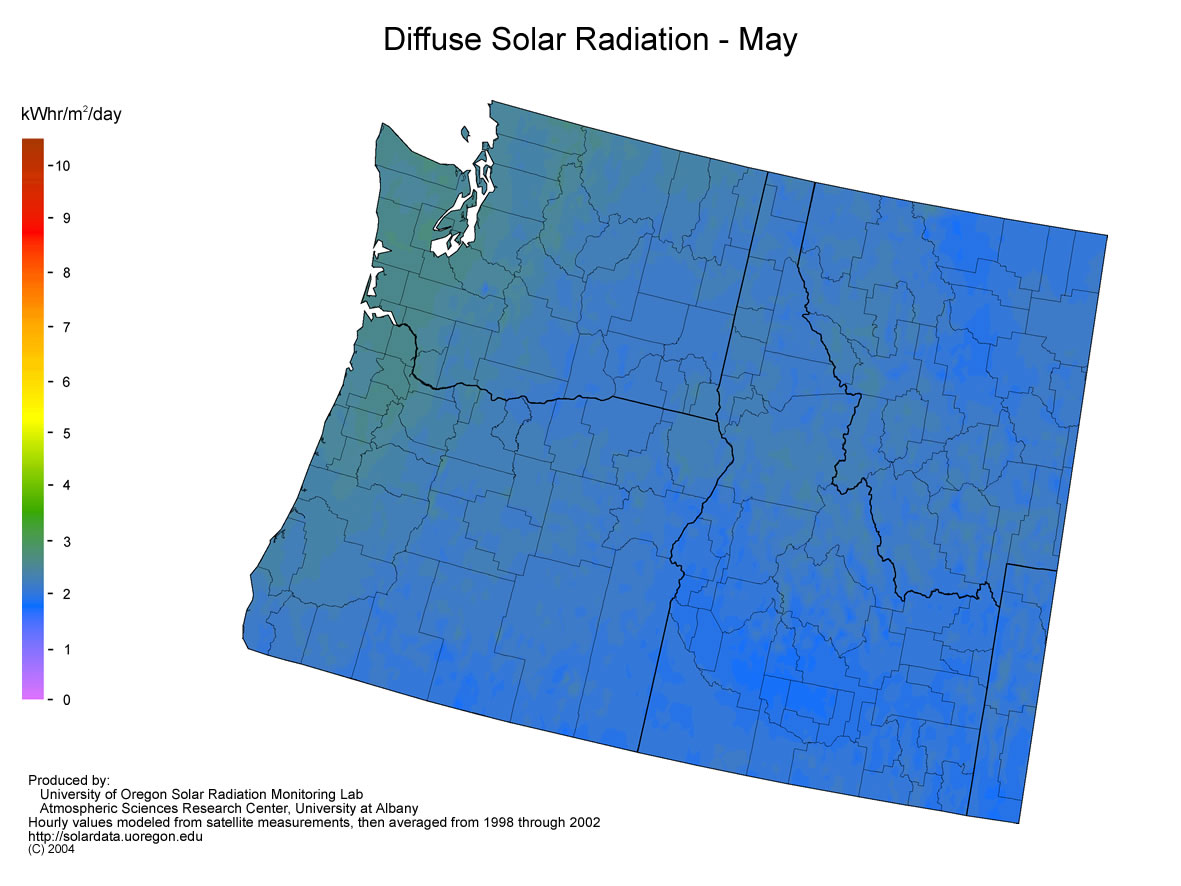
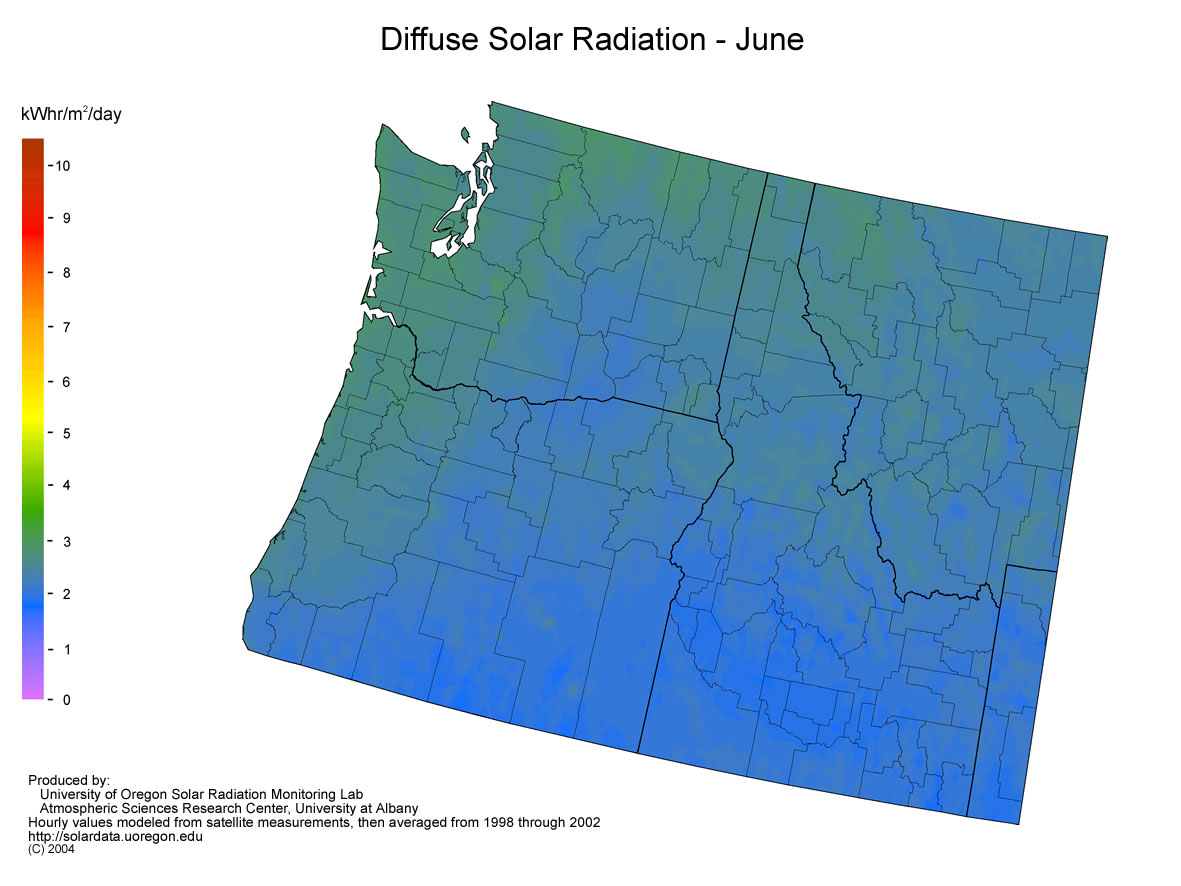
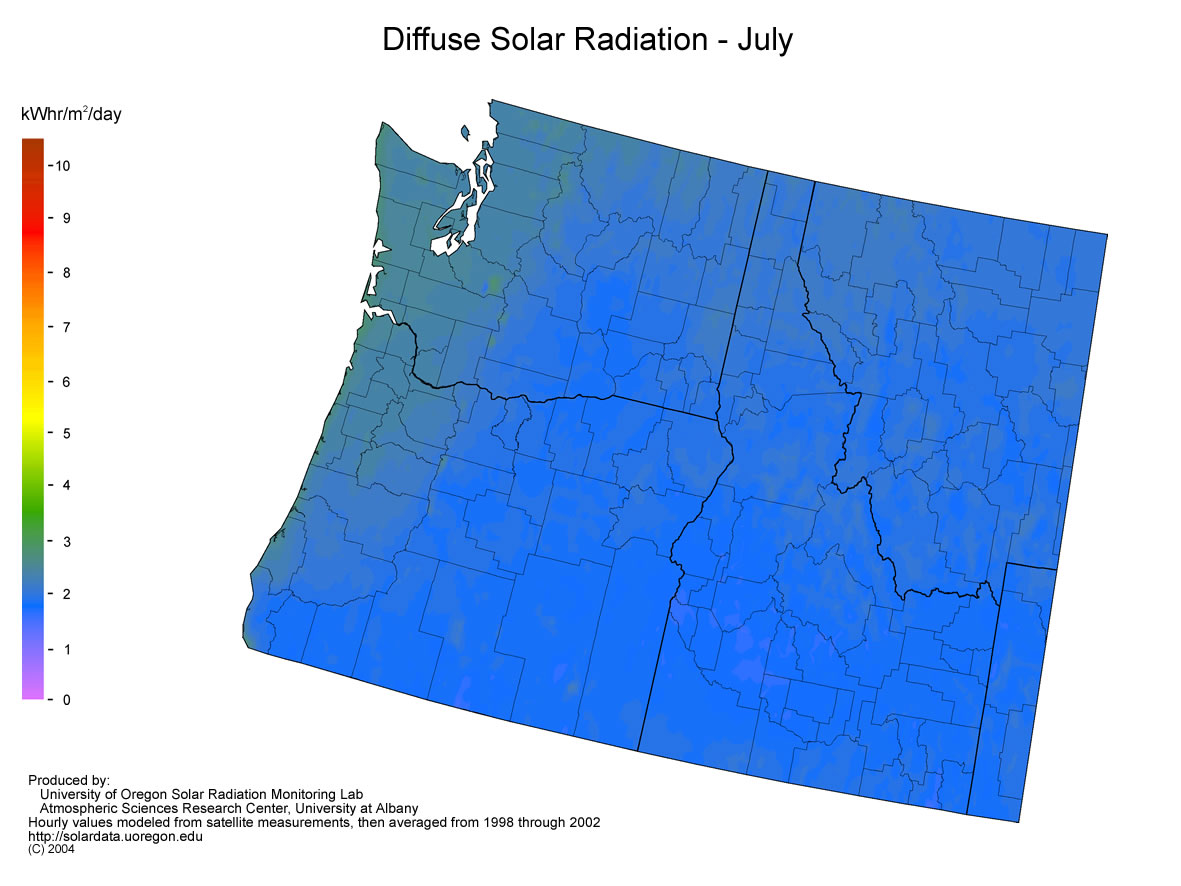
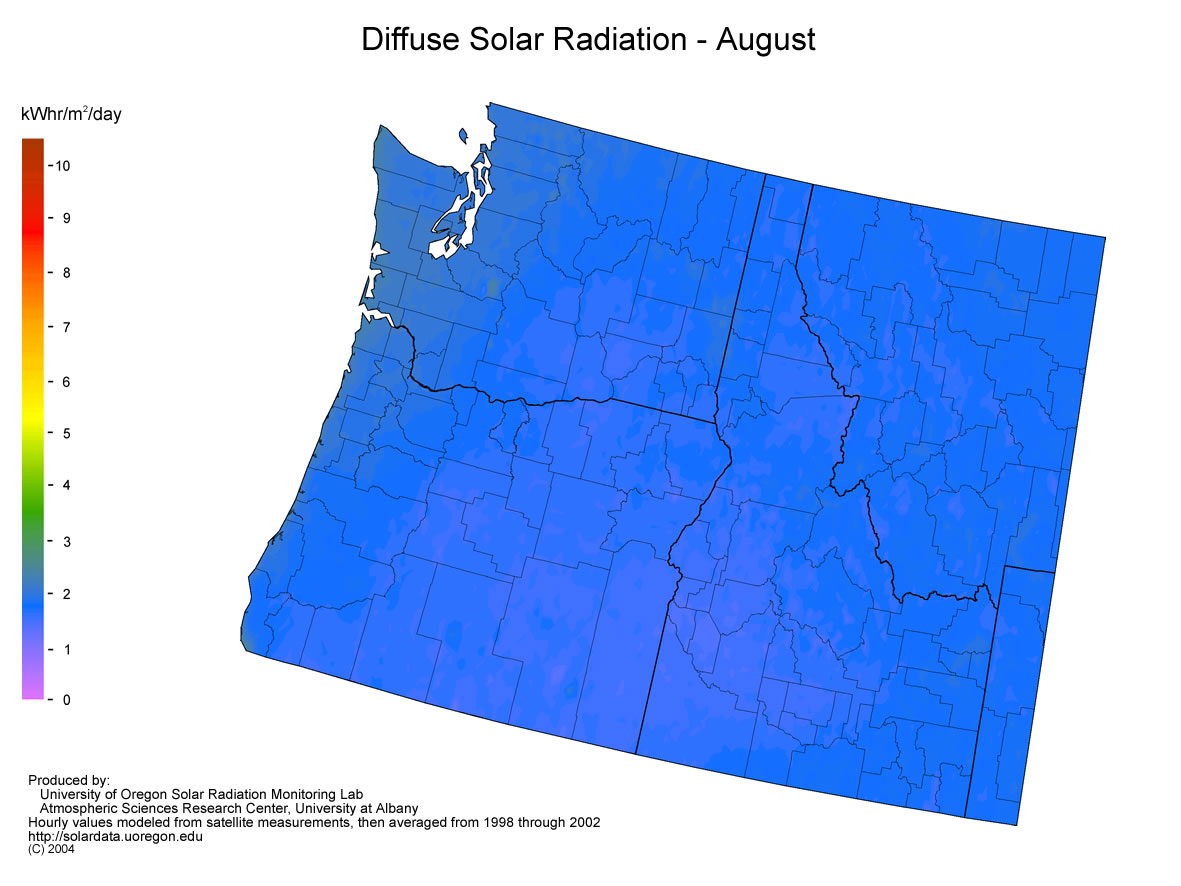
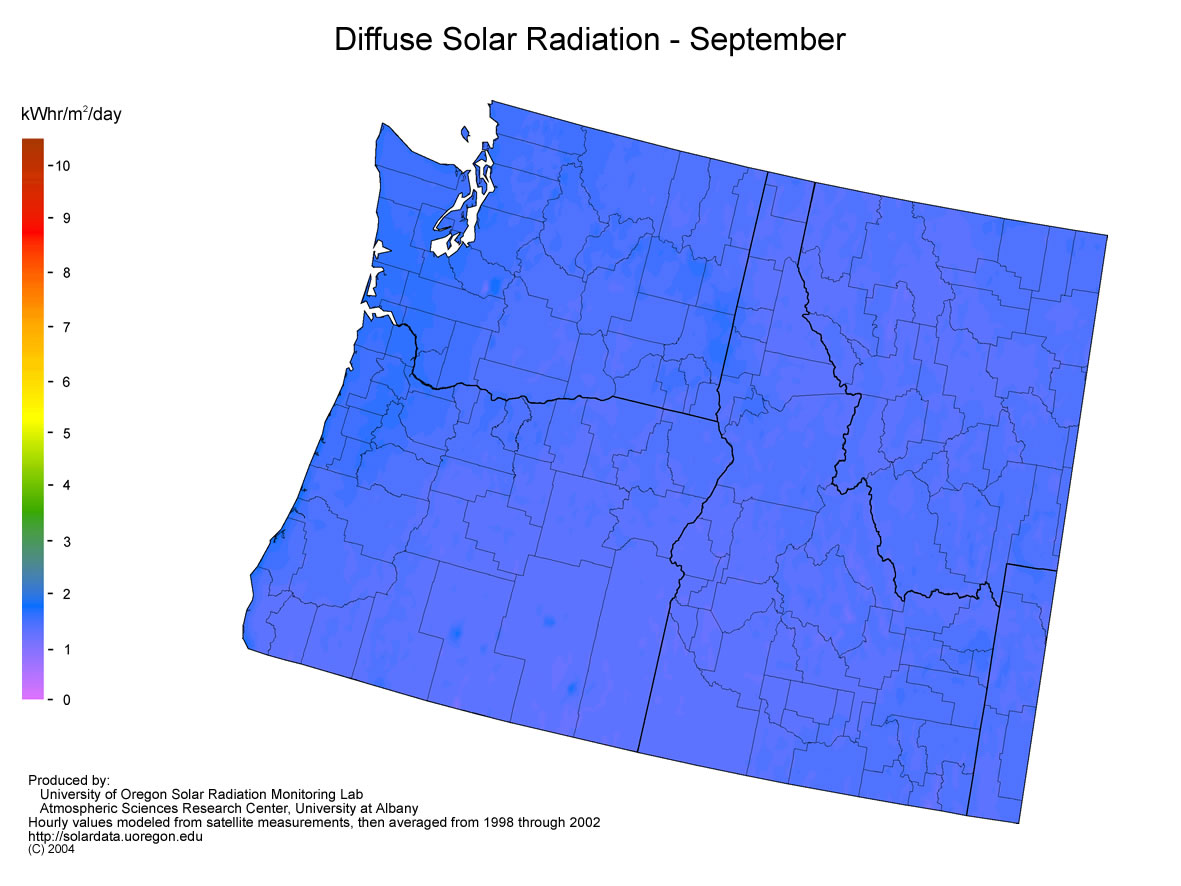
Northwest Solar Resource Maps The links below are to full-size maps of Washington, Oregon, Idaha, and parts of Montana and Wyoming. These maps show average monthly and annual values for global horizontal, direct normal, and diffuse irradiance for the area. The averages were computed using hourly data modeled from satellite photographs taken from 1998 through 2002. A description of how the data are produced is in the Final Report: Solar Resource GIS Database for the Pacific Northwest using Satellite Data. DVDs with 5 years of hourly data are available for Oregon, Washington, or Idaho at $125 each. Five years of daily total data from all Pacific Northwest locations is also available for $125. Contact the UO SRML for more information. Annual solar radiation
Monthly global horizontal radiation
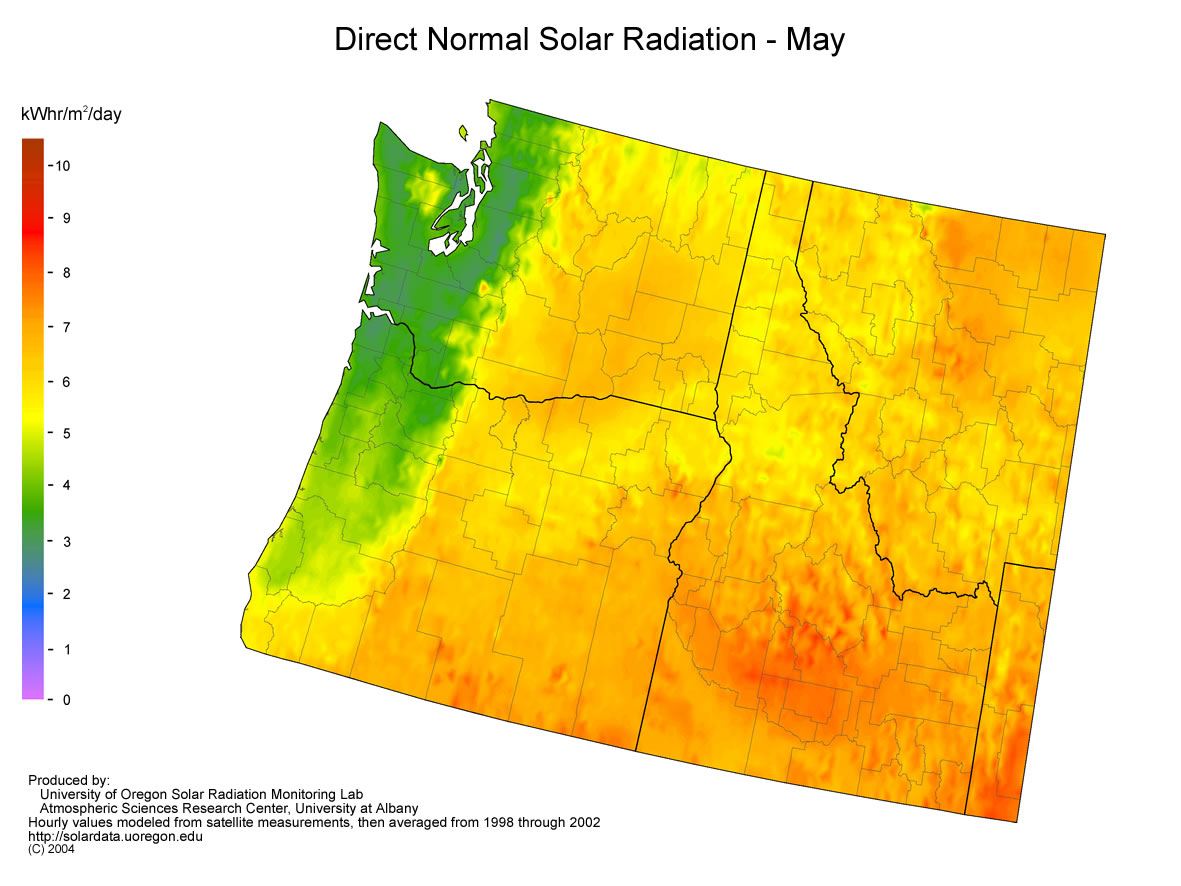
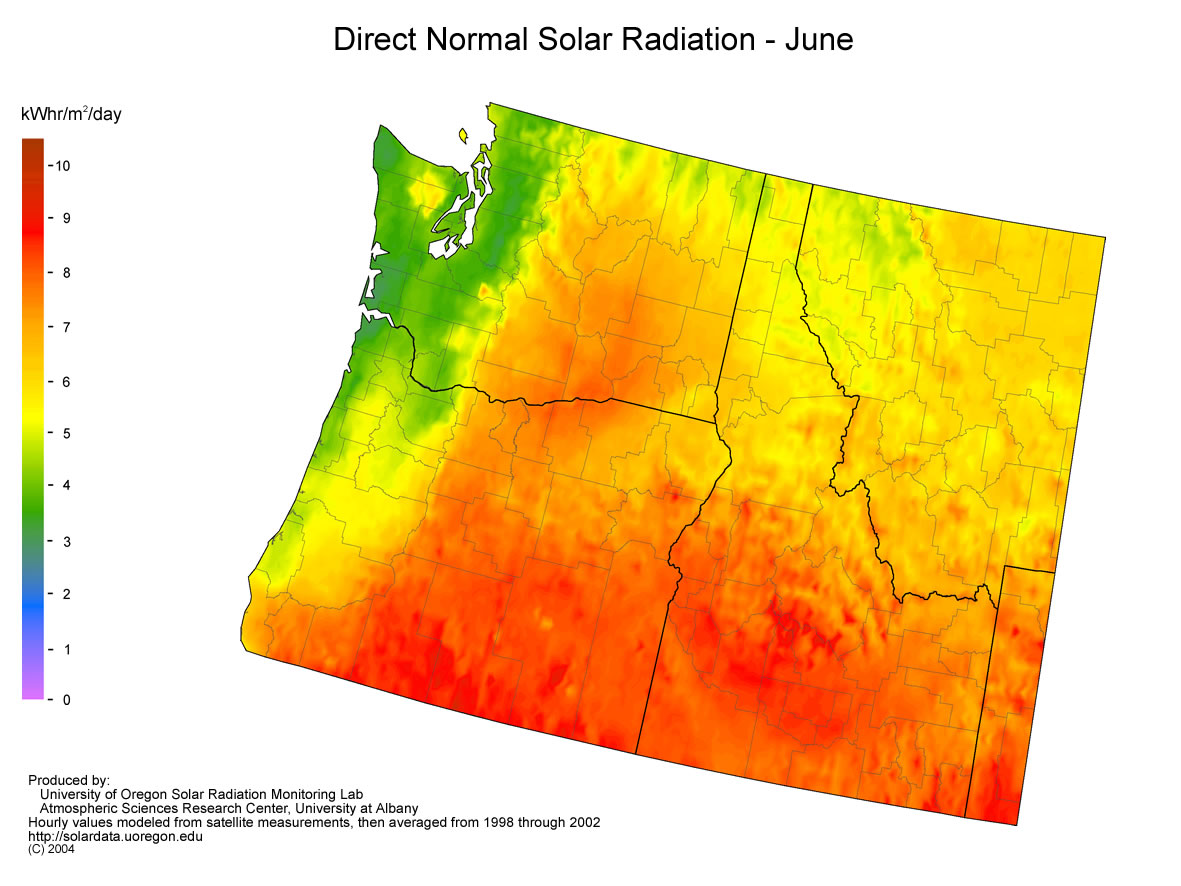
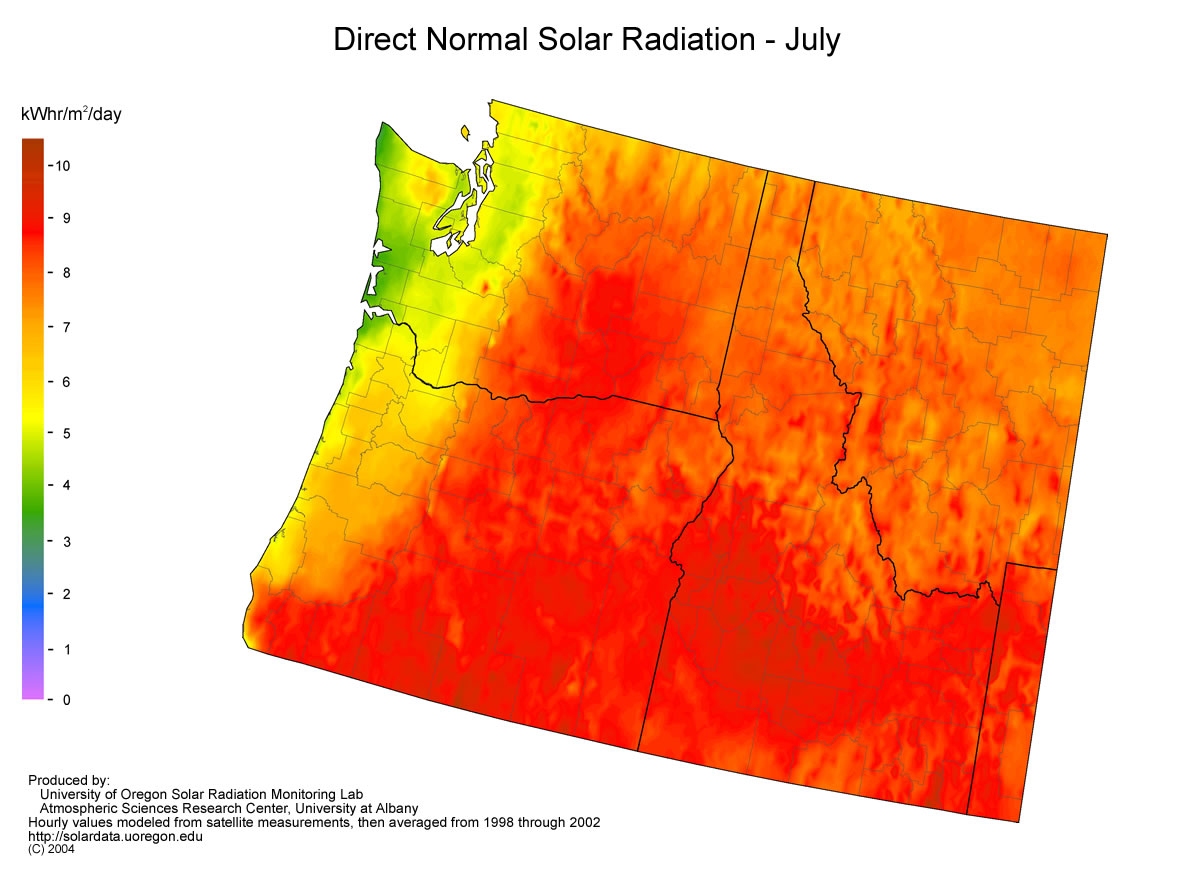
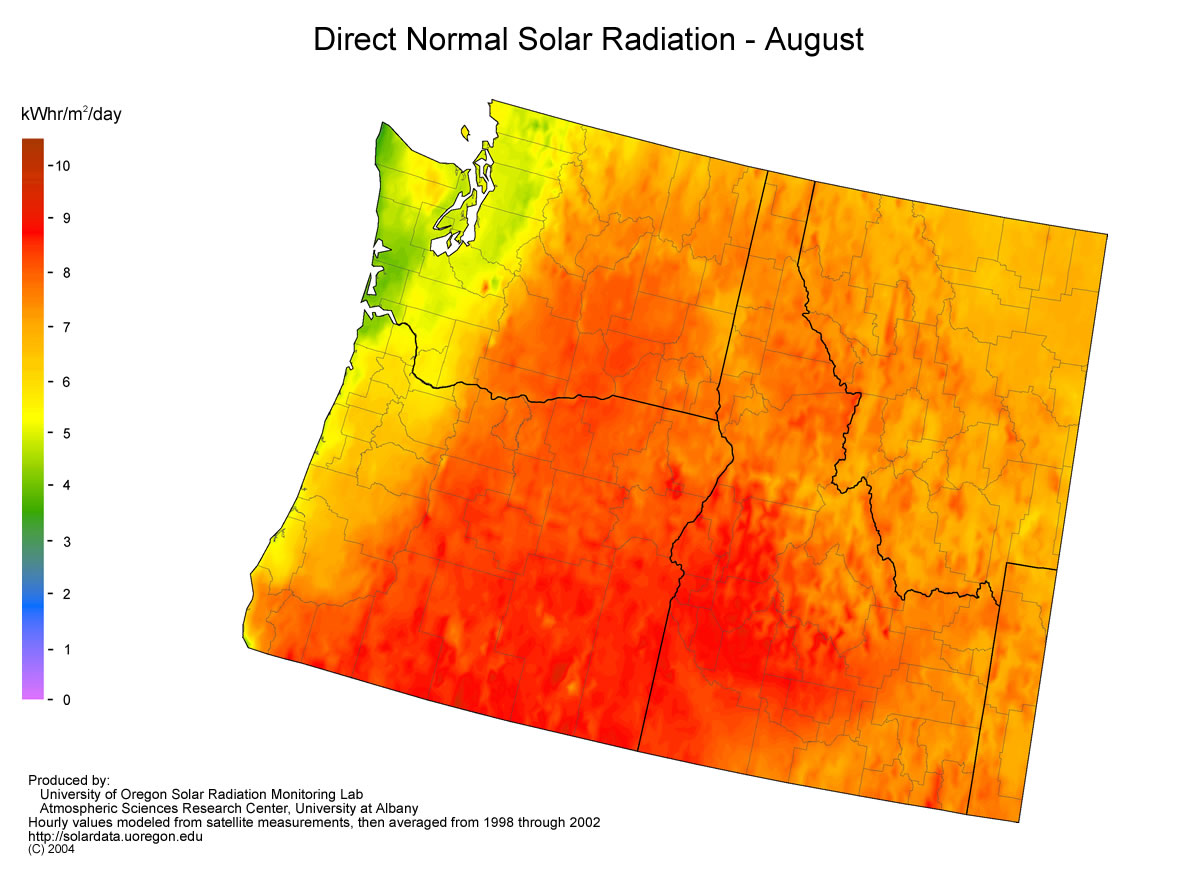
Monthly direct normal radiation
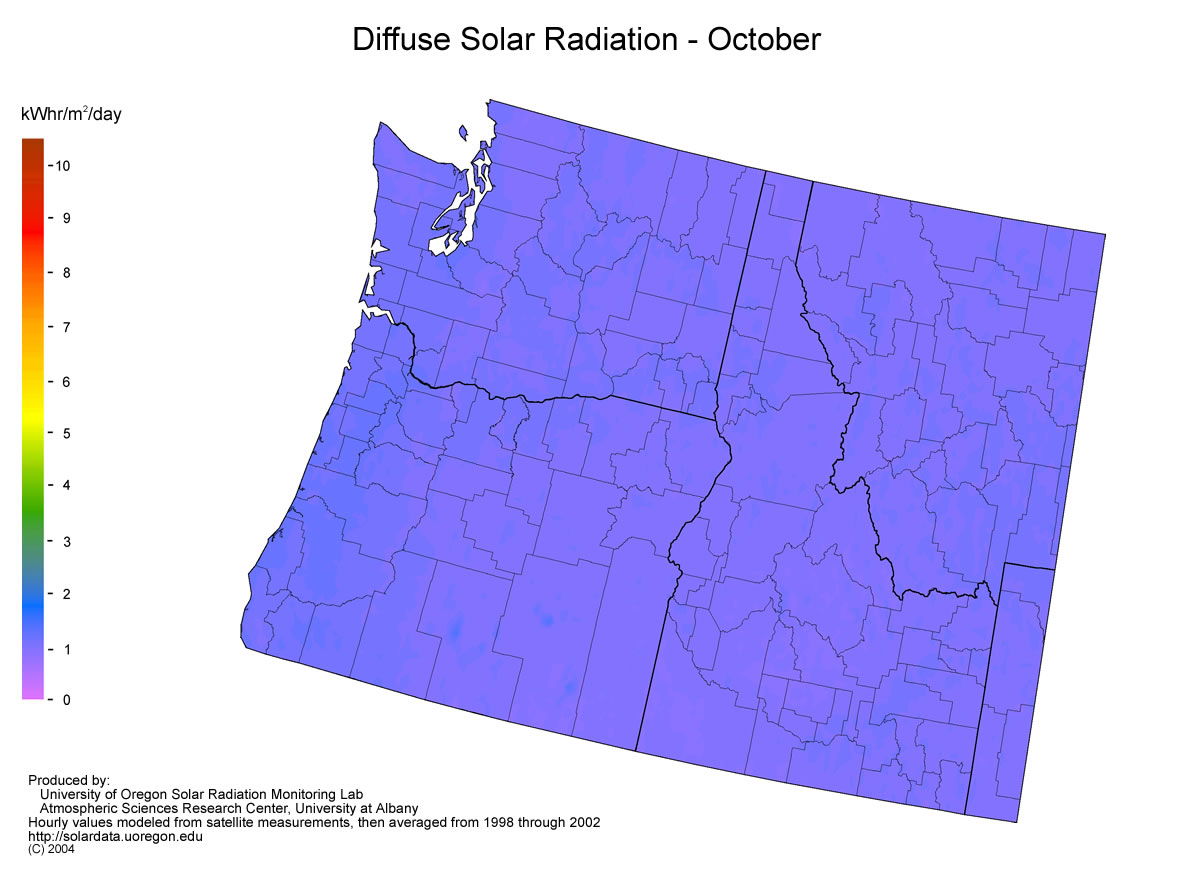
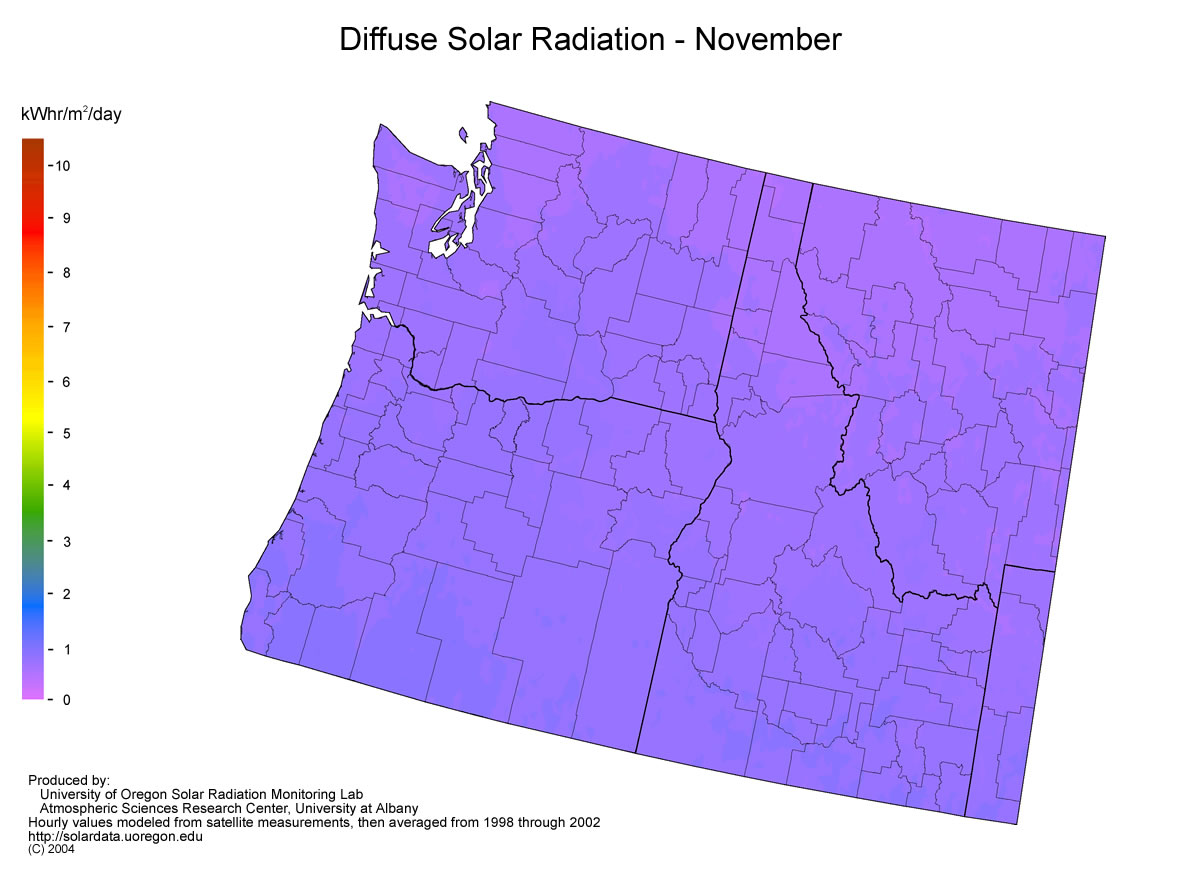
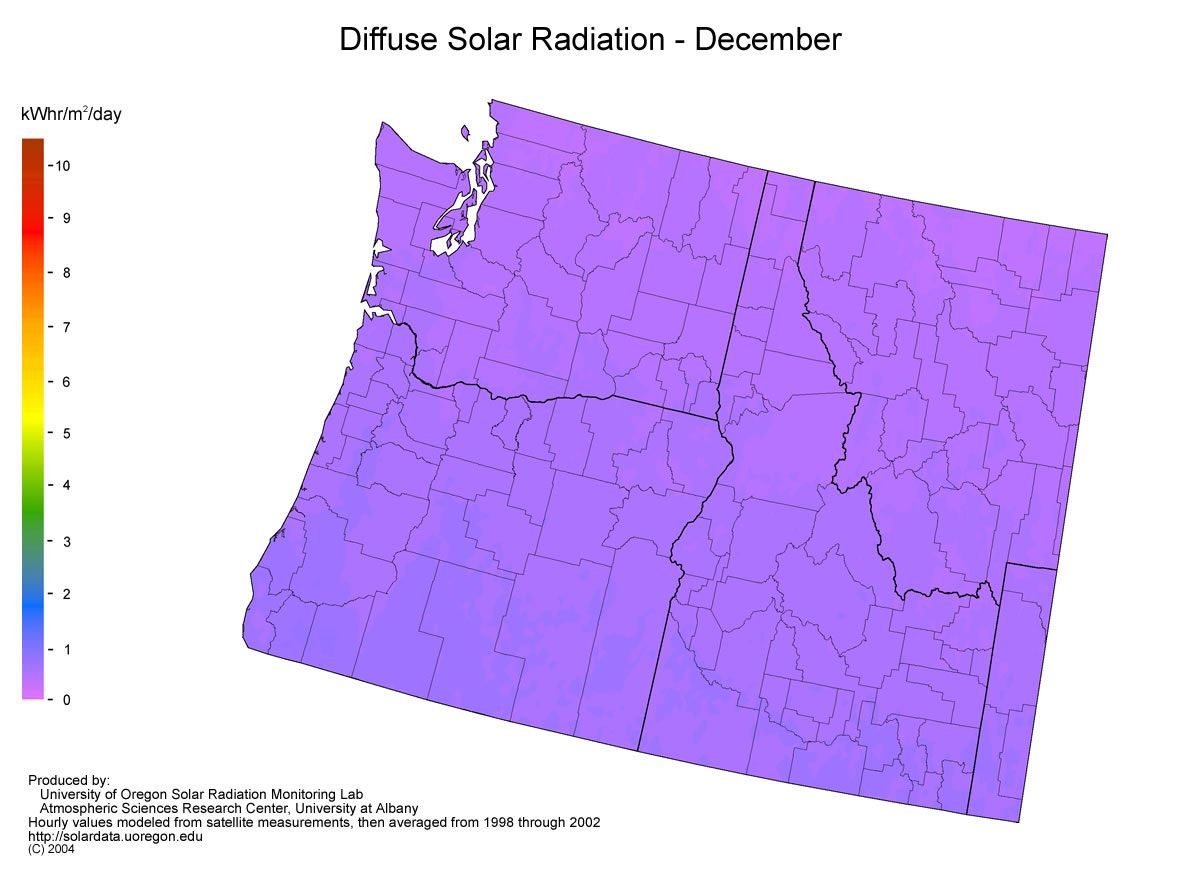
Monthly diffuse radiation
© 2022, UO Solar Radiation Monitoring Laboratory.
Home page URL: solardata.uoregon.edu |