Select contour plot
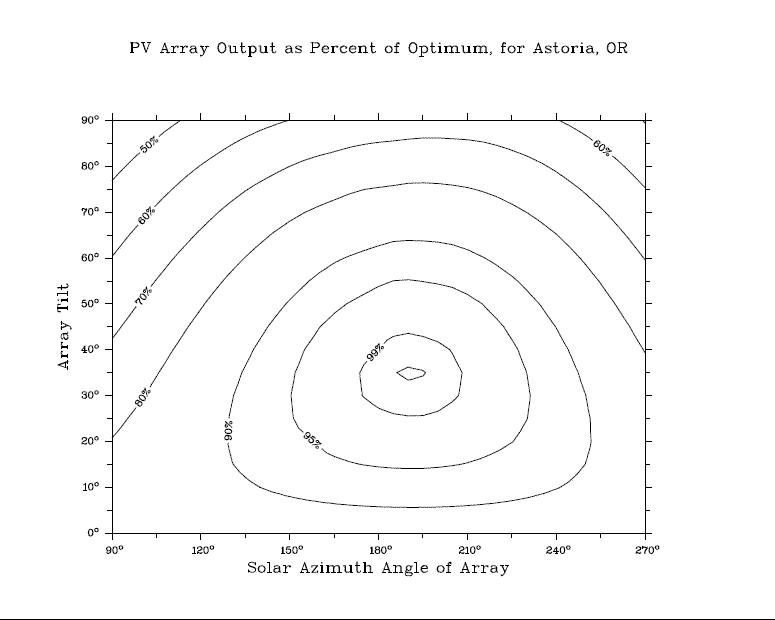
Click on the links below to download full-size PDF contour plots showing the effect of tilt and orientation on solar electric system performance. These charts show, for given locations, the amount of electricity that can be generated by a PV system for any particular tilt and orientation as a percentage of an optimally oriented system.
- Astoria
- Burns
- Eugene
- Hood River
- Klamath Falls
- Medford
- North Bend
- Pendleton
- Portland
- Redmond
- Roseburg
- Salem
The figure below is a reduced-size example for Astoria, Oregon. A solar azimuth of 180° is facing due south, 90° is facing east, and 270° is facing west. A solar electric system generally facing south and tilted between 18° (a 4/12 pitched roof) and 45° will produce at least 95% of the electricity produced by an optimally oriented system.

© 2022, UO Solar Radiation Monitoring Laboratory.
|
Top of page Site map Solar data Publications |
Home page Search Software tools |
Sponsors Contact us Educational material |
Home page URL: solardata.uoregon.edu
