
What is new in the SRML
2024-10: New Portland station
2024-09: Attended NPC 2024 at NREL
2024-08: More website upgrades
2024-07: Website upgrades
2024-06: Station upgrades to Burns and Silver Lake
Routine station maintenance to Burns and Silver Lake stations. Including newly calibrated instruments at both stations.2024-06: Attend IEEE PVSC 52 conference
Presented two talks at PVSC. One related reference cells to pyranometers. The other dealt with calibration practices. Both papers can be found here.2024-04: Preparing for calibrations
The SRML began work on calibrating the sensors at our Eugene station. The new calibration method will calibrate all sensors in Eugene.
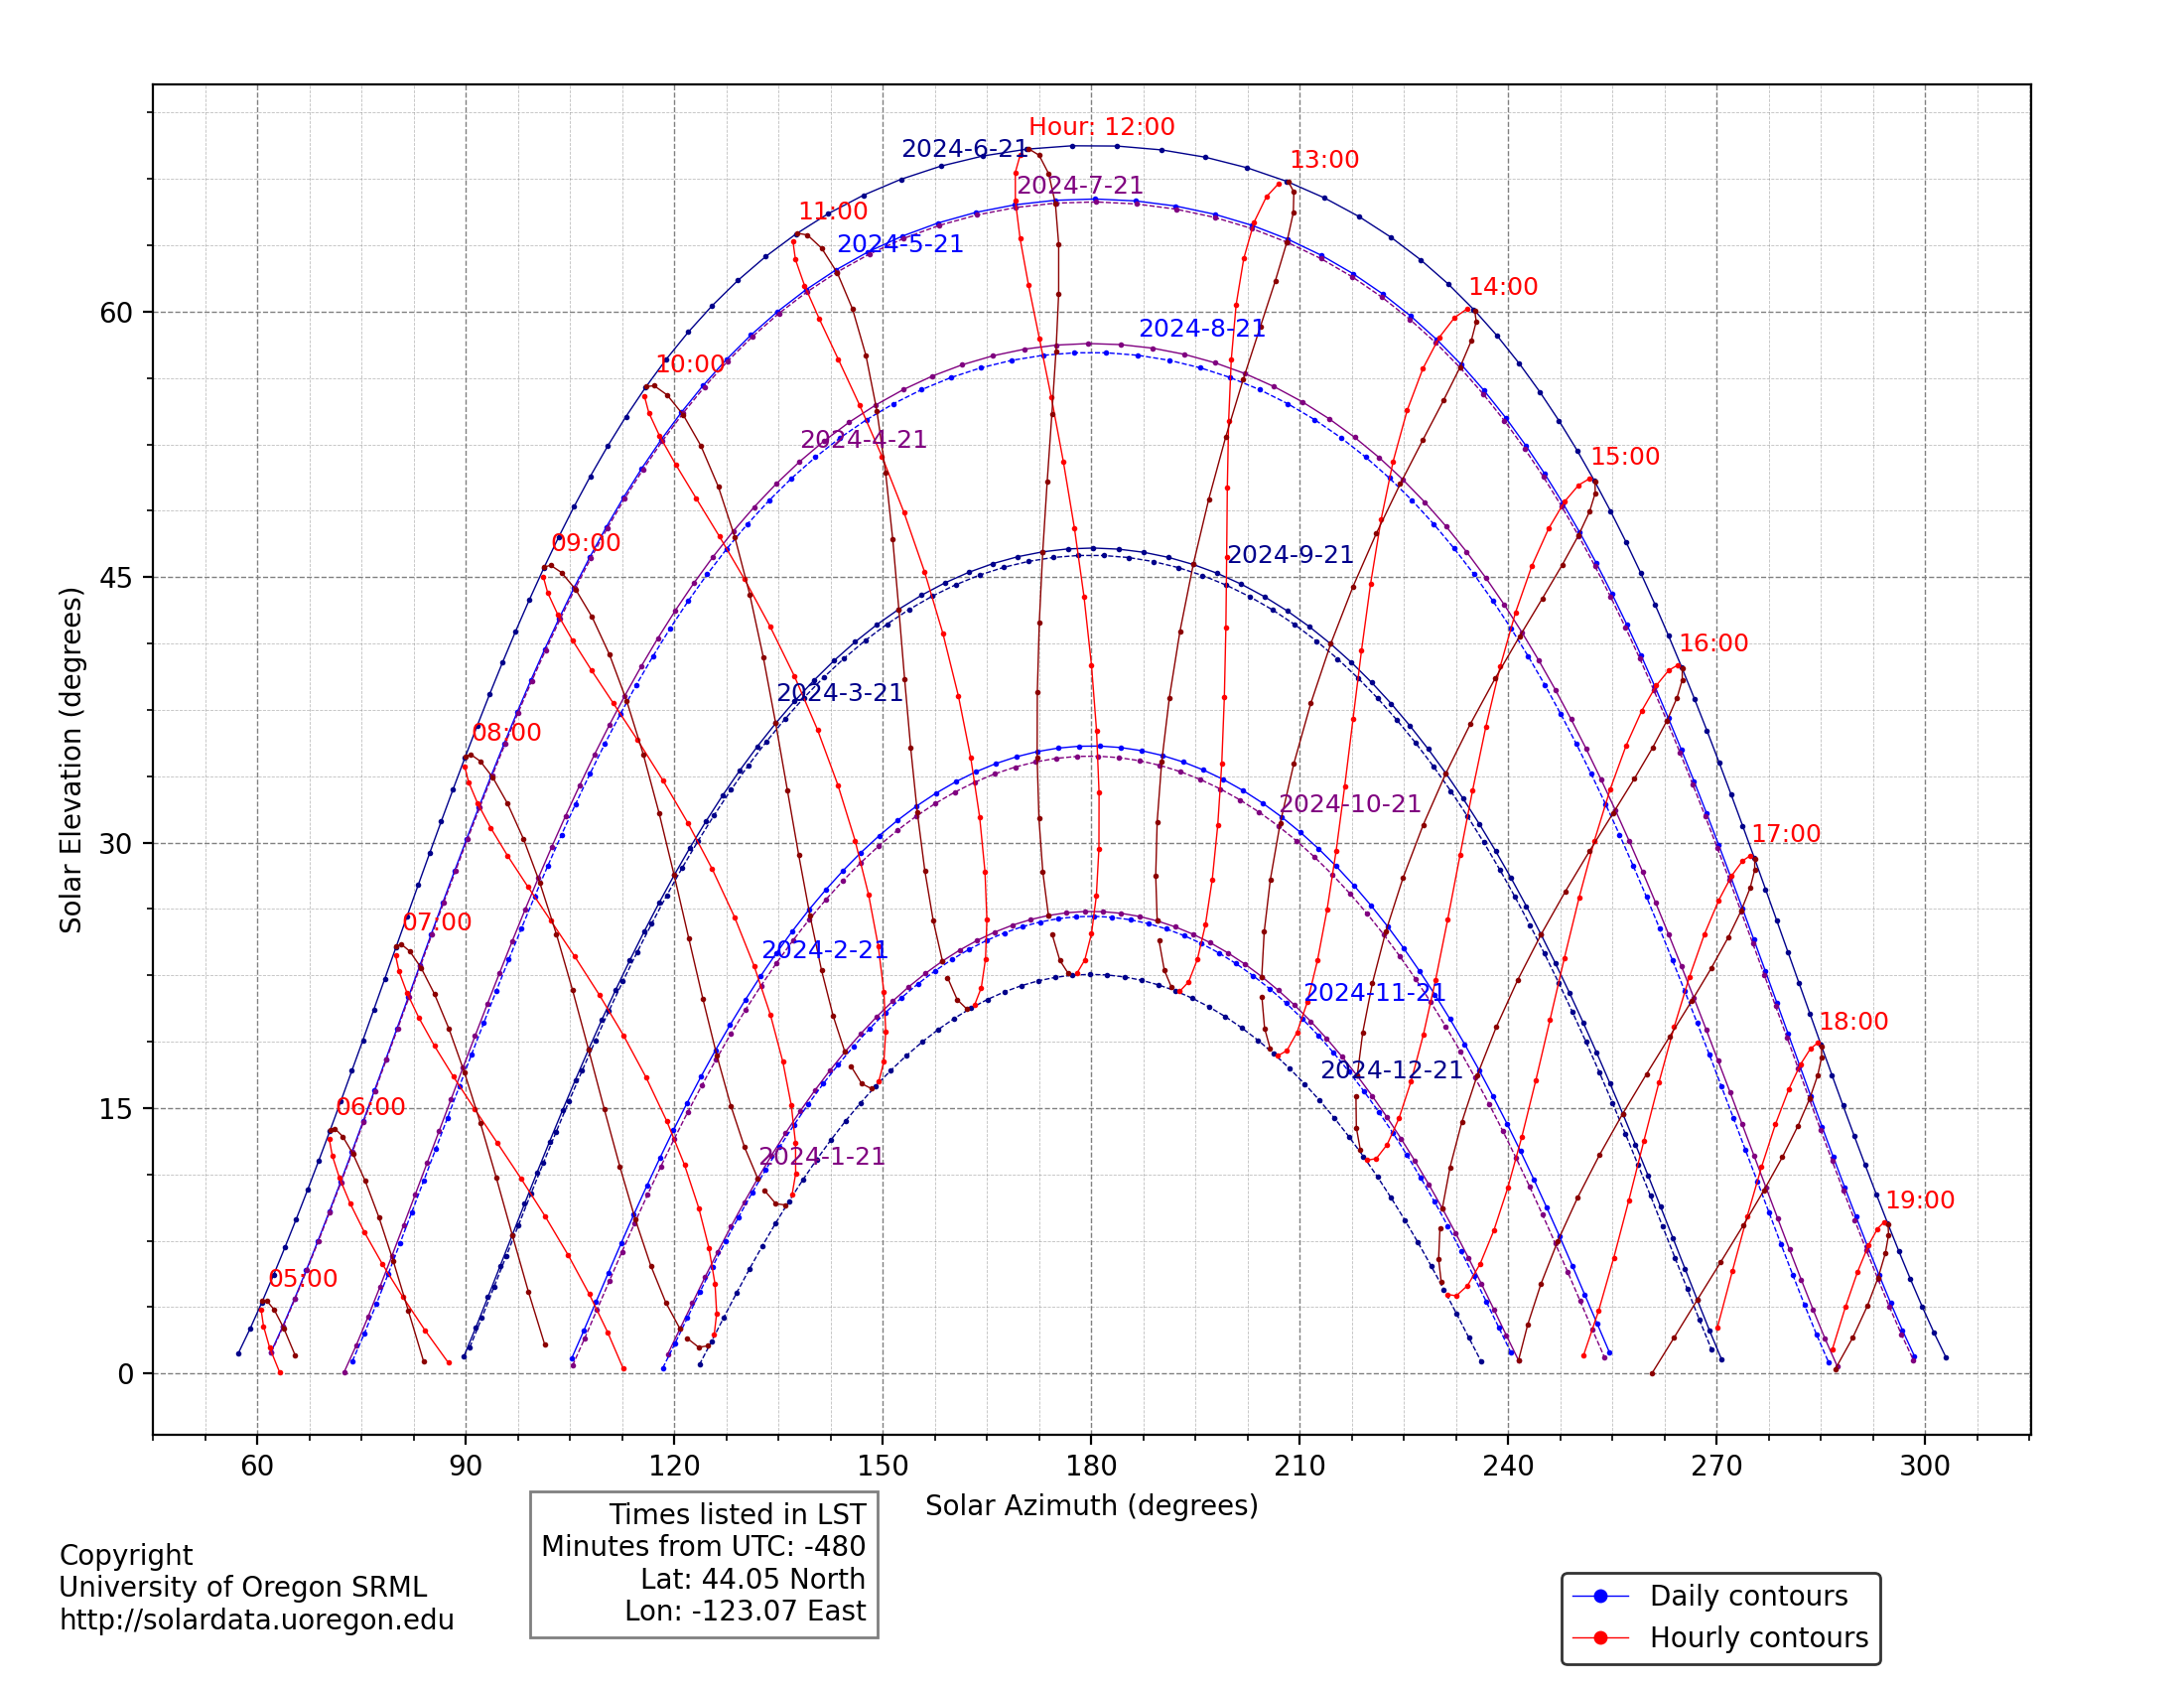
2024-03: Sun Path Charts
The SRML sun path chart program has been updated with new features.
2024-03: Eugene data loggers
Data from the Eugene station was combined to a single data logger. Previously two loggers were used to collect data from the multiple instruments. The new method uses a multiplexor to combine all sensors into a single table on the main Eugene logger.
2024-02: Video inteview with the Daily Emerald student newspaper
Youtube2024-02: Data Processing
The data from the stations is now being processed using a python based code. The new method should streamline the data prodessing. Data from all stations were standardized to a common format. The data logger programs were also standardized.
2023-11: Madras, Oregon
The SRML installed a new monitoring station in Madras, Oregon. A commissioning report for the station can be found here.
2023-09: Frank Vignola
Frank Vignola, long time director of the SRML and pioneer in the solar monitoring field passed away. His contributions to the field were enormous. He will be missed. Josh Peterson assumed leadership of the lab, carrying on Frank's legacy of continuing the lab's high quality data set.
2021-07
New Class A Hukseflux SR20 pyranometers were added to the Seattle-UW station and the Hermiston station in 2021. Also the Eppley PSP used for diffuse measurements in Seattle-UW was replaced by the Hukseflux SR20. This reduces the systematic bias in the data by using instruments with a better cosine response. Kipp & Zonen CM 11 pyranometers, also Class A instruements, were also added to most of the subsidiary stations. These instruments provide a second global measurement facilating the analysis and archiving of the data.
2020-07
The University of Oregon Solar Radiation Monitoring Laboratory enhanced its HF Absolute Cavity Radiometer (ACR) versatility by replacing the Agilent meter used to monitor the ACR by a new absolute cavity monitoring system developed by Campbell Scientific Inc. (CSI). We would like to thank CSI for their generous donation of this system to the UO SRML. This new system is highly portable and built with data-loggers that have a proven track record of working reliably in field conditions. The system is fully automated and runs on one of CSI's standard data-logger model CR1000X. The controller[1] allows more flexible control over the management of data collection from the HF ACR.
2020-06
Frank Vignola received the Charles Greeley Abbot Award from the American Solar Energy Society “For outstanding and sustained internationally recognized contributions to the field of solar resource assessment and monitoring, with ground-breaking monitoring, instrumentation development, and data archiving serving the world renewable energy R&D and industry communities.” The presentation was made at ASES Solar 20/20 virtual conference on June 24th, 2020.
2020-01
The second edition of Solar and Infrared Radiation Measurements by Frank Vignola, Joe Michalsky, and Tom Stoffel is now available at bookstores.
2018
UO SRML funders no longer support solar monitoring efforts east of Oregon and Washington.
This year we have had to decommissioned stations in Dillon, Montana, Twin Falls (Kimberly) and Challis,
Idaho, Green River, Wyoming, and Moab, Utah.
No problem is without its silver lining.
The automatic sun trackers at Dillon and Twin Falls are now installed at Burns and Hermiston, Oregon.
Burns and Hermiston now measure diffuse irradiance along with global and beam irradiance allowing a more comprehensive vetting and analysis of data from these stations.
In addition, thanks to support from NewSun Energy, we were able to install a Class A pyranometer at Burns.
This will significantly reduce the biases in the global measurements and provide a more accurate assessment of global irradiance.
2018
OTT HydroMet donated an automatic sun tracker from Kipp & Zonen to the solar monitoring network and this equipment will enable another station to measure diffuse irradiance and improve the completeness and accuracy of the data from Seattle.
2017
The National Renewable Energy Laboratory (NREL) and the UO SRML are involved in a joint project to evaluate the performance of reference solar cells and photodiode-based pyranometers on tracking surface. Picture of Mike Dooraghi, Rich Kessler, Josh Peterson, and Frank Vignola in front on a one-axis tracker with pyranometers, reference cells, and a spectroradiometer just installed in Eugene. Mike Dooraghi from NREL lead the installation with help from the UO crew.