
|
|
|
Eppley Normal Incident Pyrheliometer (NIP) 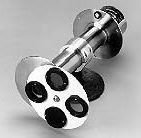 The Eppley
Normal Incidence Pyrheliometer (NIP) is a World
Meteorological Organization First Class Pyrheliometer designed for the
measurement of solar radiation at normal incidence. The NIP incorporates
a wire-wound thermopile at the base of a tube. The aperture subtends an
angle of 5.725�. The inside of this brass tube is blackened and suitably
diaphragmed. The tube is filled with dry air at atmospheric pressure and
sealed at the viewing end by an insert carrying a 1 mm thick, Infrasil II
window. Two flanges, one at each end of the tube, are provided with a sighting
arrangement for aiming the pyrheliometer directly at the sun. The Eppley
Normal Incidence Pyrheliometer (NIP) is a World
Meteorological Organization First Class Pyrheliometer designed for the
measurement of solar radiation at normal incidence. The NIP incorporates
a wire-wound thermopile at the base of a tube. The aperture subtends an
angle of 5.725�. The inside of this brass tube is blackened and suitably
diaphragmed. The tube is filled with dry air at atmospheric pressure and
sealed at the viewing end by an insert carrying a 1 mm thick, Infrasil II
window. Two flanges, one at each end of the tube, are provided with a sighting
arrangement for aiming the pyrheliometer directly at the sun.Specifications
Accuracy The NIP is calibrated against an absolute cavity radiometer. Absolute accuracy of calibration is on the order of ±2%, while the relative accuracy is about ±1%. The figure below shows a 5-year comparison of an Eppley NIP against an Absolute Cavity Radiometer [F. Vignola and Ibraham Reda, "Responsivity of an Eppley NIP as a Function of Time and Temperature", Proceedings of the 1998 Annual Conference American Solar Energy Society, 517-522, 14 Jun 1998]. Note that there is no detectable trend in the change of the responsivity over the 5-year period.  Field performance For a short period of time, the windows of the NIP were sealed with a sealant that cracked over time and allowed moisture to enter the tube. Moisture would condense on the inside of the window. Fig. 20, in the chapter entitled Use of Chart Records in Data Analysis, of our Pacific Northwest Solar Radiation Data book, presents an example of how this problem can affect the data. © 202, UO Solar Radiation Monitoring Laboratory.
Home page URL: solardata.uoregon.edu |